A product quality dashboard should do more than display defect counts. It should help factory teams decide whether a beauty device model is stable, whether one configuration or supplier is creating risk, whether production controls are detecting problems before shipment, whether field issues are recurring, and whether corrective actions are effective.
Building that dashboard is difficult because beauty devices differ in architecture and exposure. A multifunction facial system may generate pump, tubing, vacuum, handpiece, software, and accessory records. A diode laser may require handpiece, wavelength, cooling, flow, power, and output-related evidence. A body platform may have several applicators whose usage and replacement history differ from the console.
This guide explains how to define the data model, metrics, views, thresholds, drill-down paths, governance, and review process for a model-level beauty device quality dashboard.
Sumário executivo
A useful beauty device quality dashboard should:
- Start with decisions, not charts. Define who uses the dashboard and which release, containment, supplier, product, service, or improvement decisions it must support.
- Use the correct product grain. Product family, model, configuration, revision, unit serial, handpiece, component lot, software build, market, and time period should remain distinguishable.
- Connect multiple quality sources. Incoming inspection, production, testing, rework, deviations, complaints, service, returns, maintenance, and corrective actions provide different views of quality.
- Use stable definitions. Symptom, failure mode, defect location, cause, severity, disposition, recurrence, and no-fault-found status should not be mixed.
- Show numerators and denominators. Raw counts should be paired with units, lots, opportunities, operating hours, treatment cycles, installed applicators, or other relevant exposure.
- Separate frequency, severity, and operational burden. A dashboard should not hide a rare serious issue inside one composite score.
- Distinguish internal detection from field escape. More factory detections can indicate stronger controls rather than worse product performance.
- Allow drill-down to evidence. Every summary should connect to the underlying record, product configuration, raw result, investigation, and action.
- Display data quality. Missing serials, unknown configurations, unverified causes, duplicate cases, and delayed reporting affect confidence.
- Link signals to action and review. Thresholds, owners, status, due dates, effectiveness criteria, and decisions should be visible.
The dashboard succeeds when teams use it to make controlled decisions, not when it contains the greatest number of metrics.
1. Define the Dashboard Purpose
Possible purposes include:
- daily production containment;
- weekly defect and rework review;
- supplier-quality monitoring;
- monthly model health review;
- field reliability and service planning;
- corrective action effectiveness;
- product upgrade prioritization;
- management review; and
- distributor or buyer quality reporting.
One dashboard can support several purposes, but each view should state its audience, data latency, decision rights, and limitations.
2. Identify Dashboard Users
| Usuário | Pergunta principal | Needed view |
|---|---|---|
| Produção | What is blocking today’s build or release? | active defects, holds, station patterns and rework |
| Qualidade | Which issues require containment, investigation or escalation? | severity, recurrence, population and evidence status |
| Engineering | Which module, interface or configuration needs improvement? | failure mode, cause, revision and technical drill-down |
| Supplier quality | Which supplier lots or processes are unstable? | incoming rate, lot trend, recurrence and supplier actions |
| Serviço | Which models need parts, diagnostics or training? | field cases, downtime, replacements and no-fault-found patterns |
| Product management | Which model or configuration needs upgrade, restriction or retirement review? | lifecycle trend, burden, buyer impact and improvement status |
| Gerenciamento | Are major quality risks controlled and improving? | high-severity issues, trends, actions, resources and effectiveness |
Avoid giving every user the same crowded page.
3. Define the Model-Level Data Grain
A model dashboard should preserve:
- product family;
- base model;
- released configuration;
- Revisão de hardware e lista de materiais;
- software and parameter version;
- regional voltage and language profile;
- OEM or buyer-specific variant;
- work order, lot, and unit serial;
- installed handles, applicators, cartridges, or accessories;
- supplier and component lot;
- production and shipment period; and
- field age and exposure.
If the dashboard aggregates these details too early, a concentrated issue can disappear inside a model average.
4. Separate Product States
The dashboard may need to distinguish:
- planned configuration;
- as-built configuration;
- as-tested configuration;
- as-shipped configuration;
- installed configuration; and
- current serviced or upgraded configuration.
A field case should be analyzed against the configuration actually installed at the time, not only the original sales description.
5. Map the Data Sources
| Data source | Typical contribution | Atenção principal |
|---|---|---|
| Inspeção de entrada | supplier, component and lot quality | sampling and inspection coverage vary |
| Production and in-process inspection | assembly, station, operator, fixture and process evidence | one unit can contain several defects |
| Functional and aging tests | configuration-specific performance evidence | detection methods and limits can change |
| Nonconformance and rework | failure, correction, disposition and burden | final pass can hide earlier failure |
| Deviations and concessions | accepted exceptions and scope | approval does not equal normal conformance |
| Final inspection and release | completion and package evidence | final yield can hide rework volume |
| Complaints and service | field symptoms, downtime and customer impact | allegations are not always confirmed defects |
| Returns and teardown | verified field evidence | returned population can be biased |
| Maintenance and parts | wear, replacement and service workload | expected maintenance must be separated from failure |
| Corrective actions | cause, action, implementation and effectiveness | closure status alone does not prove effectiveness |
The source map should define system owner, refresh frequency, keys, quality checks, and retention.
6. Create Stable Keys
Use controlled identifiers such as:
- `model_id`;
- `configuration_id`;
- `hardware_revision`;
- `software_build_id`;
- `work_order_id`;
- `unit_serial`;
- `component_part_revision`;
- `supplier_lot`;
- `handle_or_applicator_id`;
- `inspection_record_id`;
- `nonconformance_id`;
- `service_case_id`;
- `complaint_id`; and
- `corrective_action_id`.
Product names and free-text descriptions are useful labels but weak relational keys.
7. Build a Common Defect Taxonomy
The dashboard should separate:
Reported symptom
What was observed, such as no output, low suction, unusual noise, error code, intermittent operation, overheating, or missing accessory.
Verified failure mode
How the requirement was not met, such as leakage, blockage, drift, open circuit, incorrect recognition, communication timeout, or dimensional mismatch.
Defect location
Where the issue was confirmed, such as pump, cable, connector, board, sensor, handpiece, applicator, cartridge, motor, software, label, or package.
Cause and confidence
Unknown, suspected, contributing cause verified, root cause verified, multiple causes, or inconclusive.
Disposition
Rework, repair, return, scrap, use-as-is under authorization, replacement, or release after defined retest.
These layers support different charts and should not share one uncontrolled field.
8. Add Category-Specific Taxonomy Layers
Universal codes can cover power, control board, software, cooling, connectors, enclosure, labels, and packaging. Category overlays can add:
- Hydra: pump, vacuum, tubing, bottle, valve, filter, seal, fluid path, handle, and tip;
- HIFU: handle, cartridge, recognition, shot count, cooling, and output-related function;
- Laser/IPL: optical path, wavelength, handpiece, spot size, cooling, flow, power, and control;
- MNRF: durable handle, needle tip, depth, movement, recognition, and RF-related function;
- Cryolipolysis: applicator, temperature, vacuum, membrane, contact, sensor, and alarm;
- EMSlim: applicator, channel, cable, recognition, positioning, and RF-related module;
- Endos Velapro: roller, motor, vacuum, cable, handle, wear, noise, and vibration; and
- RF cavitation: functional board, handpiece, cable, connector, contact, and shared load.
The dashboard can then compare shared systems across models while preserving architecture-specific detail.
9. Define the Core KPI Families
Supplier and incoming quality
- lots inspected;
- units inspected;
- rejected lots or units;
- defect rate by part and supplier;
- repeat supplier issue;
- incoming containment age; and
- supplier corrective action status.
Production quality
- first-pass yield;
- affected-unit rate;
- defects per opportunity;
- rework and retest rate;
- scrap;
- station and shift trend;
- aging-test failures; and
- release holds.
Field quality
- confirmed incident rate;
- complaint rate;
- active device-month exposure;
- downtime;
- repeat repair;
- replacement-part rate;
- no-fault-found percentage; and
- early-life versus wear-related pattern.
Improvement control
- open recurring issues;
- corrective action age;
- implementation status;
- verification status;
- post-action recurrence; and
- effectiveness acceptance.
Data quality
- missing serial or configuration;
- unknown supplier lot;
- uncoded symptom;
- unverified failure mode;
- unknown cause;
- duplicate cases; and
- reporting delay.
10. Show Numerator and Denominator Together
| Métrica | Numerator | Denominator |
|---|---|---|
| incoming defect rate | nonconforming items | items inspected |
| production affected-unit rate | units with one or more defects | units tested or completed |
| defect opportunity rate | defect events | relevant assembly or test opportunities |
| field incident rate | confirmed incidents | active device-months or another valid exposure |
| handpiece incident rate | handpiece failures | installed handpiece-months |
| consumable issue rate | confirmed consumable issues | consumables used or supplied |
| rework burden | rework hours or cost | units produced |
A percentage without its count and population can be misleading, especially for low-volume models.
11. Separate Frequency, Severity, and Burden
Use different visual areas for:
- event frequency;
- affected-unit rate;
- severity and risk;
- detectability;
- rework and scrap;
- shipment delay;
- field downtime;
- repair time;
- customer impact; and
- engineering or supplier effort.
Do not hide a rare serious issue inside an average quality score.
12. Distinguish Internal Detection from Field Escape
Algumas visualizações úteis incluem:
- defects detected before final test;
- defects detected during aging;
- defects detected during final inspection;
- defects found after packaging but before shipment;
- installation or early field cases;
- confirmed field escapes; and
- wear or maintenance events.
An increase in internal detection can be positive if field escapes decline and production controls become more effective.
13. Show Product Volume, Maturity, and Exposure
Every model view should show:
- units produced;
- units shipped;
- installed population where known;
- active field exposure;
- product age;
- revision age;
- number of active configurations;
- number of included handles or applicators; and
- data completeness.
New and mature models should not be ranked by percentages without showing these differences.
14. Build a Model Health Summary
The first model page can contain:
- current production and field population;
- quality status and major open risks;
- last refresh and data completeness;
- first-pass yield and rework burden;
- field incident trend;
- high-severity open cases;
- top defect families;
- supplier and revision hotspots;
- open corrective actions;
- recent changes; and
- decisions or actions due.
Keep the page compact enough for review, with links to deeper views.
15. Create a Quality Funnel
A quality funnel can show:
- units or lots received;
- material accepted;
- units started;
- units passing first time;
- units reworked;
- units passing after retest;
- units released;
- units shipped;
- field cases reported; and
- confirmed field defects.
The funnel reveals where losses, detection, and data gaps occur. It should not imply that each stage uses the same population or time lag without explanation.
16. Use Pareto Views Correctly
Build separate Pareto charts for:
- defect events;
- affected units;
- rework hours;
- scrap or replacement cost;
- shipment delay;
- field downtime;
- severity-weighted review; and
- recurrence after action.
State the population, date range, model, configuration, source, and counting rule on each view.
17. Add Trend and Control Views
Depending on the data, use:
- run charts;
- control charts;
- rolling rates;
- cumulative recurrence;
- cohort charts;
- heat maps by revision and period;
- supplier-lot trends;
- station or fixture comparisons; and
- field age or time-to-event plots.
Annotate supplier, component, software, fixture, process, inspection, and configuration changes. A trend without change context is difficult to interpret.
18. Use Thresholds with Context
Threshold types can include:
- fixed quality limit;
- statistical control limit;
- risk-based escalation rule;
- change from baseline;
- recurrence after corrective action;
- supplier performance target;
- data-quality minimum; and
- overdue-action limit.
Every threshold should define owner, response, review timeframe, and exception authority. Red color without a required action is decoration, not control.
19. Design Drill-Down Paths
From a model summary, users should be able to drill into:
- category and function;
- Configuração e revisão;
- work order and serial;
- defect family and failure mode;
- component and supplier lot;
- production stage and station;
- software and parameter version;
- handpiece, applicator, cartridge, or consumable;
- service case or complaint;
- investigation and root-cause evidence;
- rework and retest; and
- corrective action and effectiveness.
The drill-down should preserve filters and definitions so users do not lose the original comparison context.
20. Connect the Dashboard to Raw Evidence
A summary point should link to records such as:
- inspection measurement;
- test log;
- image or waveform;
- nonconformance record;
- teardown or failure analysis;
- supplier report;
- service notes;
- returned-unit evaluation;
- software log;
- deviation approval;
- corrective action; and
- product-change record.
Access controls can protect confidential or personal information while preserving evidence for authorized users.
21. Show Data Confidence
Add confidence indicators based on:
- population size;
- exposure completeness;
- serial and configuration completeness;
- confirmed versus alleged cases;
- cause-confidence status;
- reporting delay;
- duplicate risk;
- inspection coverage;
- source reconciliation; and
- revision stability.
Low confidence should trigger investigation or cautious interpretation, not automatic green status.
22. Handle No-Fault-Found Cases
Display no-fault-found cases separately and allow drill-down by:
- reported symptom;
- configuration;
- software build;
- operating condition;
- logs available;
- diagnostic steps;
- parts replaced;
- recurrence;
- distributor or service center; and
- transport or environmental condition.
A high no-fault-found rate may indicate intermittent behavior, weak logging, incomplete returns, accessory issues, or inadequate reproduction methods.
23. Track Recurrence
Distinguish:
- first occurrence;
- repeated failure on the same unit;
- same failure mode on another unit;
- same cause across another model;
- recurrence after correction;
- recurrence after corrective action;
- legacy-unit event after a production change; and
- adverse effect caused by the change.
The recurrence rule should be controlled so closing and reopening decisions remain consistent.
24. Track Corrective Action Effectiveness
Show:
- issue family;
- affected population;
- verified cause;
- approved action;
- implementation boundary;
- resultado da verificação;
- regression status;
- effectiveness metric;
- baseline and target;
- exposure achieved;
- recurrence after action;
- review owner; and
- closure or reopening status.
Completion of tasks should not appear as proof that recurrence has fallen.
25. Track Product and Process Changes
The dashboard should annotate:
- supplier changes;
- component substitutions;
- drawing and BOM revisions;
- software releases;
- parameter updates;
- fixture changes;
- test-method changes;
- process and instruction changes;
- packaging revisions;
- service campaigns; and
- regional or OEM configuration launches.
Change overlays help teams identify whether a shift is technical, operational, or caused by altered detection.
26. Example: A0648 Model Dashboard
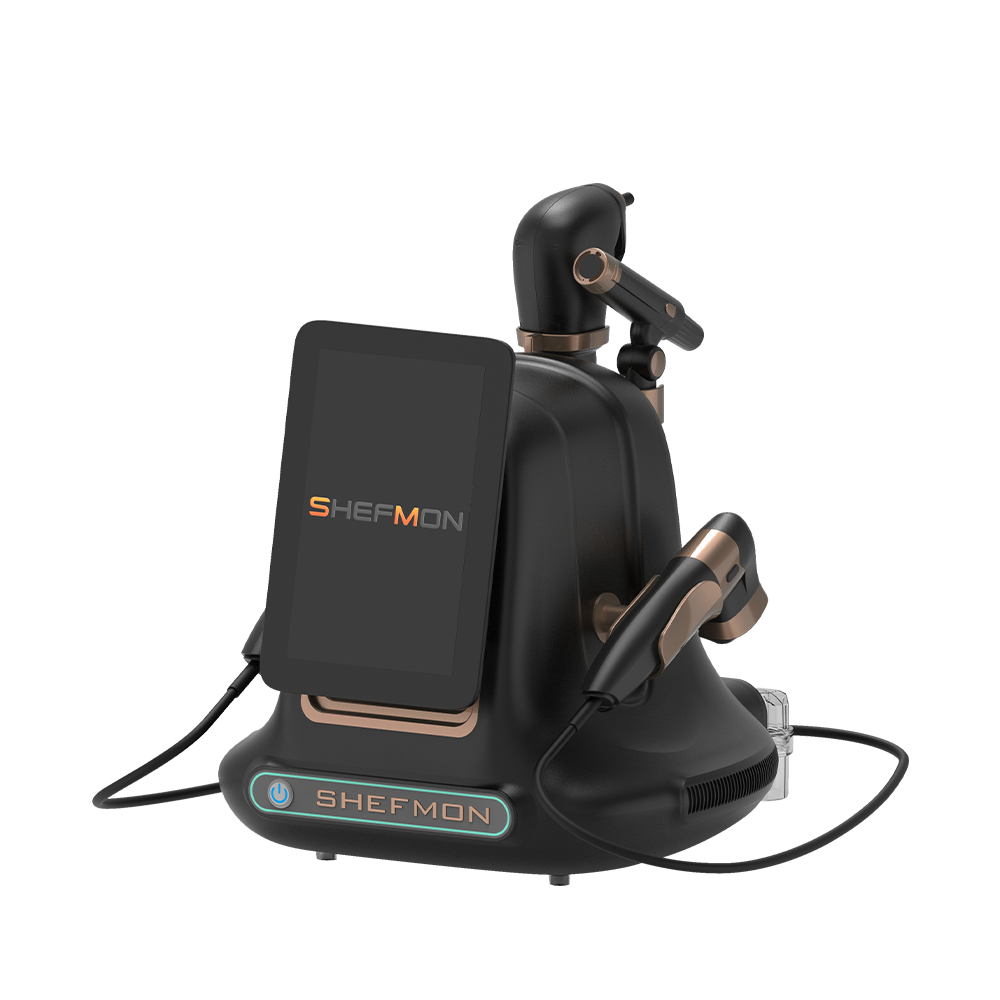
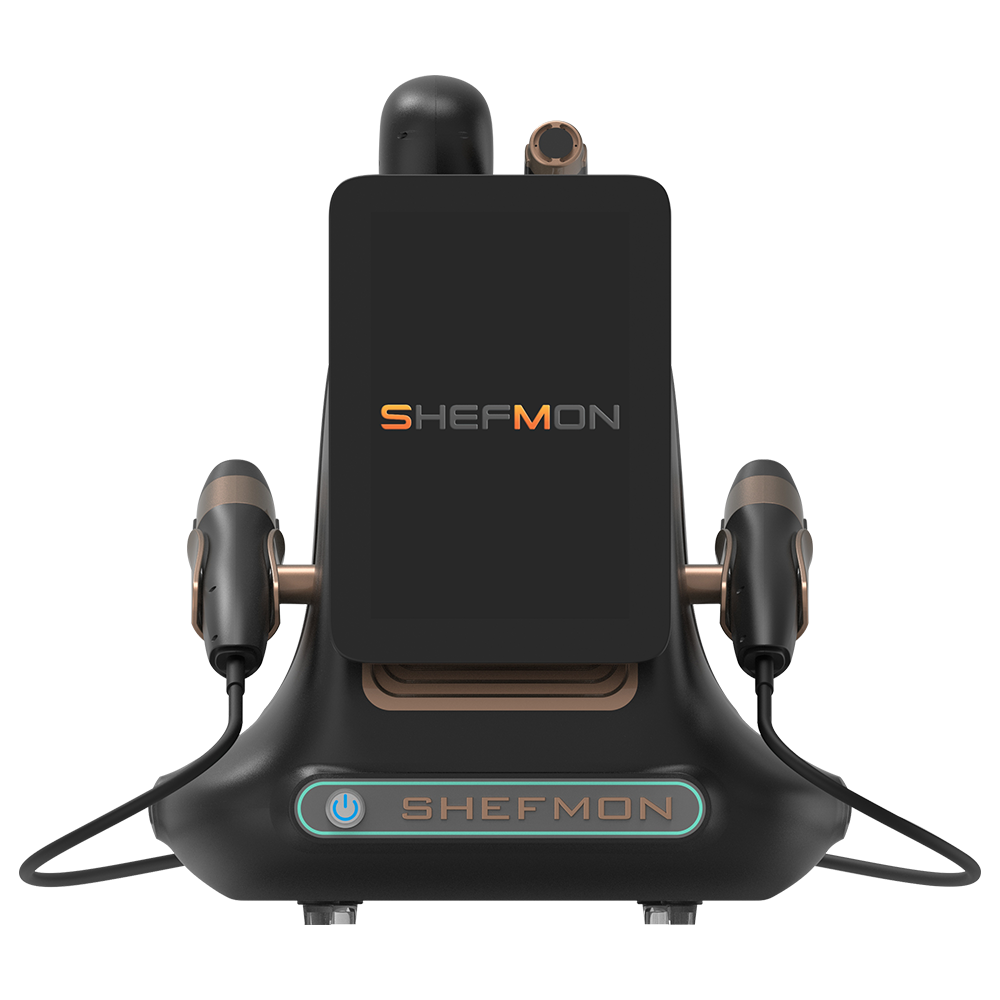
O oficial Máquina de microdermoabrasão hidrostática SHEFMON A0648 is presented as a multifunction facial platform involving vacuum, cleansing, extraction, hydration, and multiple tools.
An A0648-type dashboard can separate:
- console and software;
- pump and vacuum performance;
- tubing, bottles, valves, filters, and seals;
- leakage, blockage, flow, and suction;
- each included handle and tip;
- accessory and package completeness;
- cleaning or maintenance condition;
- production and aging detection;
- field service by function; and
- component-lot and configuration trends.
This is a proposed dashboard structure, not a statement of actual SHEFMON defects.
27. Example: A0426 Model Dashboard
O oficial SHEFMON A0426 diode laser page lists wavelength, handpiece-power, spot-size, cooling, voltage, and language options.
An A0426-type dashboard can filter by:
- wavelength and handpiece configuration;
- handpiece power and spot size;
- console and handpiece serial;
- cooling and flow components;
- power and control assemblies;
- software, parameters, and language;
- regional electrical profile;
- output-related and cooling-test evidence;
- field exposure by handpiece; and
- replacement, repair, and recurrence.
Combining all configurations into one model rate could hide an option-specific issue.
28. Example: B0155 Model Dashboard
O oficial SHEFMON B0155 Desktop Endos Velapro page presents a multi-handle body platform involving vacuum-roller, rotating, RF-related, and cavitation functions.
A B0155-type dashboard can separate:
- base console and shared power;
- software and function board;
- actual handle package;
- handle serial or identity;
- cable and connector;
- motor, roller, vacuum, RF-related, and cavitation functions;
- handle-specific test and service data;
- expected wear versus premature failure;
- installed-handle exposure; and
- maintenance and replacement history.
Console-level and handle-level reliability should remain connected but distinct.
29. Create a Cross-Model Comparison View
| Comparison area | Required context |
|---|---|
| affected-unit rate | units tested, model maturity and configuration mix |
| first-pass yield | test coverage, number of functions and process opportunities |
| field incident rate | installed population, field age and exposure completeness |
| severity | common severity logic and category-specific technical review |
| rework burden | labor, retests, parts, scrap and release delay |
| supplier quality | shared part, supplier, lot and inspection coverage |
| accessory reliability | installed handles, applicators, cartridges or consumables |
| corrective action | issue scope, implementation boundary and effectiveness exposure |
| data confidence | missing identity, unknown cause and reporting delay |
The comparison should support investigation and resource allocation, not produce a simplistic league table.
30. Choose Visuals That Match the Question
Usar:
- KPI tiles for a small number of current statuses;
- lines for trends over time;
- bars for category or model comparison;
- Pareto charts for concentrated defect families;
- heat maps for model, revision, station, supplier, or period;
- funnels for quality stages;
- scatter plots for frequency versus severity or burden;
- control charts for stable repeated processes;
- tables for precise actions, owners, due dates, and evidence; and
- cohort or survival views for field-age patterns.
Avoid decorative gauges and excessive color. Users should be able to read values, definitions, and exceptions directly.
31. Design Filters Carefully
Core filters can include:
- date range;
- product family and model;
- Configuração e revisão;
- source and lifecycle stage;
- defect system and failure mode;
- severity;
- supplier and component lot;
- work order and station;
- software version;
- market and OEM buyer;
- handpiece or applicator;
- confirmed status; and
- corrective action relationship.
Show active filters clearly and provide a reset function. Saved review views can preserve approved reporting definitions.
32. Define Refresh and Data Latency
Not every source updates at the same speed.
Definir:
- source refresh frequency;
- last successful load;
- data period covered;
- delayed complaints or service cases;
- manual review queues;
- correction and reconciliation cycle;
- frozen month-end snapshot; and
- handling of late-arriving data.
A dashboard that updates hourly can still contain month-old service data. Make latency visible.
33. Preserve Historical Definitions
Metrics, defect codes, product hierarchies, and thresholds change over time.
Controlar:
- metric definition and owner;
- data de entrada em vigor;
- calculation version;
- code mapping;
- historical restatement rule;
- threshold changes;
- dashboard release version; and
- archived snapshots.
Do not silently apply a new definition to historical data without documenting the effect.
34. Validate Dashboard Calculations
Before use, test:
- record counts against source systems;
- joins and duplicate handling;
- model and configuration mapping;
- numerator and denominator logic;
- time zones and date boundaries;
- status and severity mapping;
- unit conversions;
- missing-value treatment;
- late-arriving data;
- filter behavior;
- drill-down reconciliation;
- user access; and
- exported report consistency.
Use known test datasets and edge cases. A visually correct dashboard can still contain incorrect joins or rates.
35. Establish Dashboard Governance
Assign ownership for:
- data sources;
- product master and configuration hierarchy;
- defect taxonomy;
- metric definitions;
- dashboard software and changes;
- access control;
- data-quality review;
- threshold approval;
- action assignment;
- meeting cadence; and
- archive and retention.
Changes should receive review proportional to their effect on quality decisions.
36. Link Signals to an Action Register
A dashboard signal should create or connect to:
- issue ID;
- decision or action;
- proprietário;
- due date;
- affected population;
- containment;
- investigation status;
- corrective action;
- verification and effectiveness criteria;
- closure evidence; and
- reopening rule.
Without action linkage, teams can discuss the same red trend every month without changing the product or process.
37. Use the Dashboard in Review Meetings
Daily review
Focus on active holds, severe defects, production interruptions, and immediate containment.
Weekly technical review
Focus on recurring failure modes, supplier lots, investigations, rework, test issues, and cross-model implications.
Monthly model review
Focus on normalized trends, field evidence, revisions, corrective action effectiveness, and product improvements.
Management review
Focus on major risks, resources, overdue actions, quality objectives, systemic issues, and decisions requiring authority.
The FDA-hosted MDSAP management review procedure provides an authoritative example of using summary reports and trend analyses as management-review inputs. Applicable manufacturers should follow their own controlled procedures and market requirements.
38. Common Dashboard Mistakes
Starting with software
Choosing a visualization platform before defining decisions, data, and ownership creates attractive but weak reports.
Showing raw counts only
Volume and exposure differences make totals difficult to compare.
Using one quality score
A composite score can hide severity, field escapes, and data gaps.
Combining configurations
One hardware revision, software build, handpiece, or supplier lot can drive the trend.
Treating tickets as confirmed failures
Allegations, no-fault-found cases, maintenance, and confirmed defects require separate statuses.
Ignoring data quality
Missing serials and unknown configurations can create a falsely reassuring result.
Allowing definitions to drift
Changing metric logic without version control destroys trend comparability.
Failing to connect actions
The dashboard should show who is responding and whether the response works.
39. Product Quality Dashboard Checklist
Before release, confirm:
- Users and decisions are defined.
- Product family, model, configuration, revision, and serial grains are controlled.
- Incoming, production, test, rework, field, service, return, and corrective-action sources are mapped.
- Stable keys connect the sources.
- Symptom, failure mode, location, cause, severity, and disposition are separated.
- Category-specific taxonomy layers are available.
- Every rate shows numerator, denominator, population, and period.
- Frequency, severity, detectability, and burden remain distinct.
- Internal detection and field escape are separated.
- Product volume, maturity, and exposure are visible.
- No-fault-found and unconfirmed cases remain visible.
- Data quality and confidence are displayed.
- Change events are annotated.
- Thresholds have owners and required responses.
- Drill-down reaches source evidence.
- Calculation, join, duplicate, filter, and missing-value logic are tested.
- Definitions and dashboard versions are controlled.
- Signals link to actions, decisions, and effectiveness checks.
- Review cadence and decision authority are documented.
- Archived snapshots support historical reconstruction.
Perguntas frequentes
1. What is the most important metric on a beauty device quality dashboard?
There is no single universal metric. The dashboard should combine affected-unit rate, severity, field escape, rework burden, exposure, recurrence, corrective-action status, and data confidence according to the decision.
2. Should the dashboard display defect counts or rates?
Both. Counts show workload and rates support comparison. Always display the numerator, denominator, population, and time period.
3. How should different beauty device models be compared?
Align configuration, revision, lifecycle stage, exposure, inspection coverage, maturity, severity, and data quality. Avoid ranking raw totals.
4. Should every service ticket count as a product defect?
No. Separate reported allegations, confirmed defects, no-fault-found cases, maintenance, installation, use, transport, accessory, and documentation issues.
5. How should multifunction machines appear on the dashboard?
Show the base console and each function, board, handle, applicator, or consumable relationship. A single model rate can hide one weak module.
6. How often should dashboard data refresh?
Match refresh frequency to the decision. Production containment may need daily or faster data, while field trends may update weekly or monthly. Display latency explicitly.
7. What should happen when a KPI crosses a threshold?
The threshold should trigger a defined review, owner, timeframe, containment or investigation rule, and decision record. Color alone is insufficient.
8. How can teams verify dashboard accuracy?
Reconcile counts and rates with source systems, test joins, duplicates, filters, date logic, missing data, configuration mapping, and drill-down using known datasets and edge cases.
9. Can a dashboard replace management review?
No. It provides structured inputs. Authorized teams still need to interpret uncertainty, risk, resources, actions, and decisions.
10. What quality information does SHEFMON publish?
O SHEFMON quality-control page describes incoming material testing, circuit-board aging and power testing, functional aging, inspection, and ERP management. Buyers seeking model-specific evidence should contate SHEFMON with the model, configuration, period, metric definition, denominator, and report purpose.
Conclusão
A beauty device product quality dashboard should connect model and configuration identity, quality records, exposure, severity, operational impact, investigations, and actions. It should not hide uncertainty inside one score or allow attractive charts to replace evidence.
The best dashboard starts with controlled data definitions, shows internal and field performance separately, supports category-specific drill-down, displays data confidence, and links every significant signal to an owner and effectiveness review. That structure turns quality data into better supplier, production, service, and product decisions.
Explore o SHEFMON beauty-machine portfolio and review the Processo de controle de qualidade SHEFMON. To discuss model-level quality evidence, contate SHEFMON with the exact model, configuration, period, inspection or field population, metric definitions, and decision the dashboard must support.