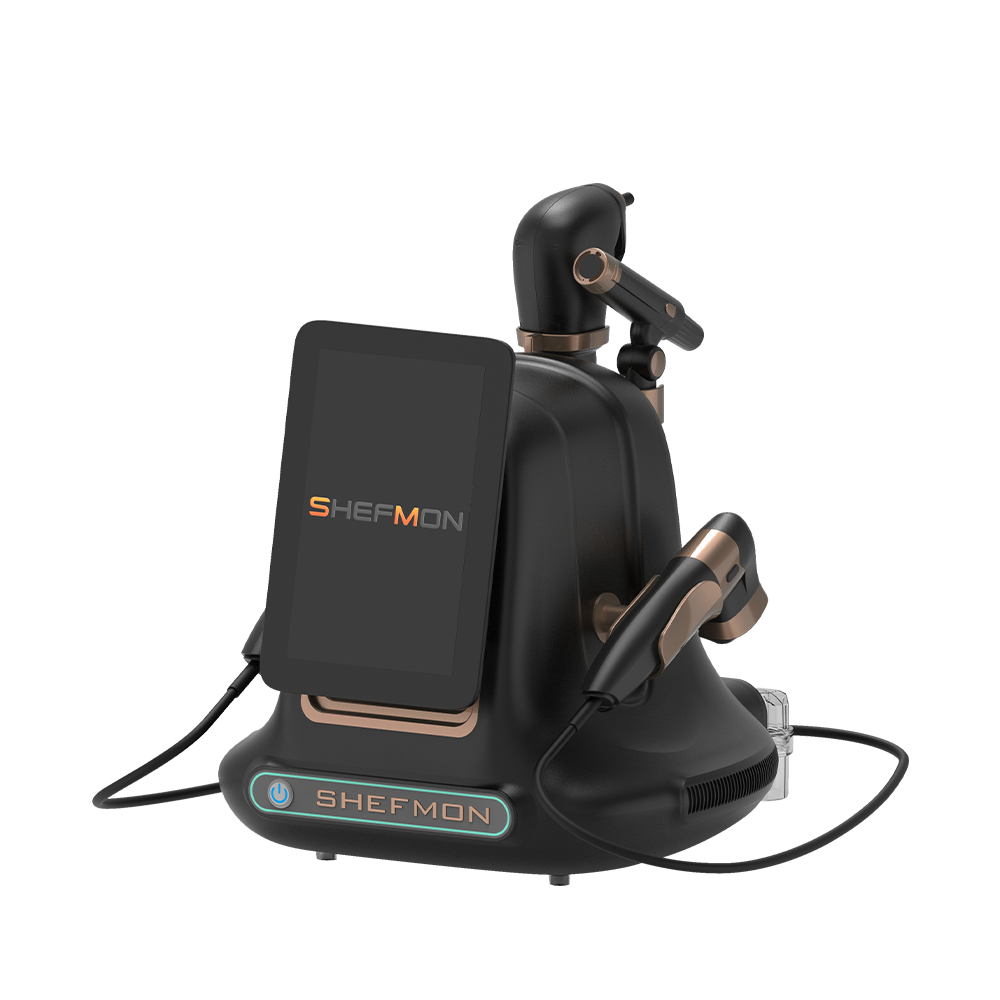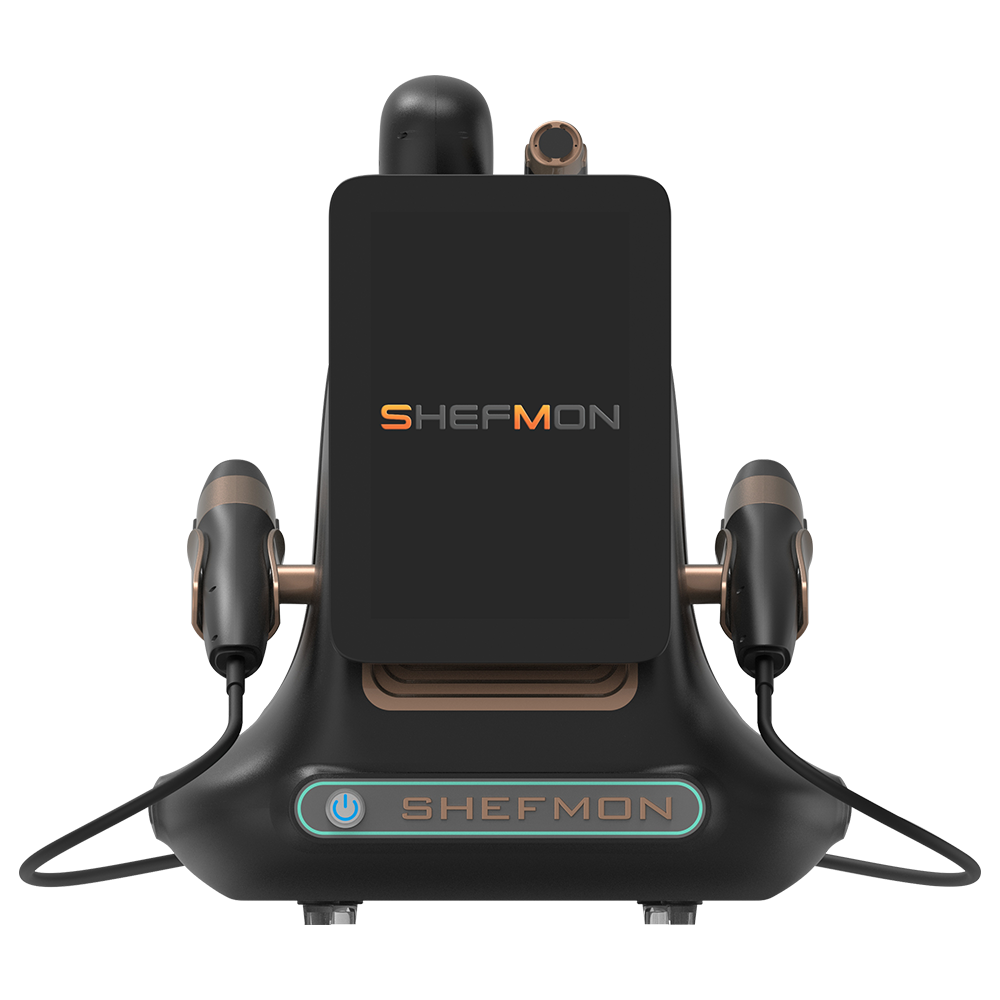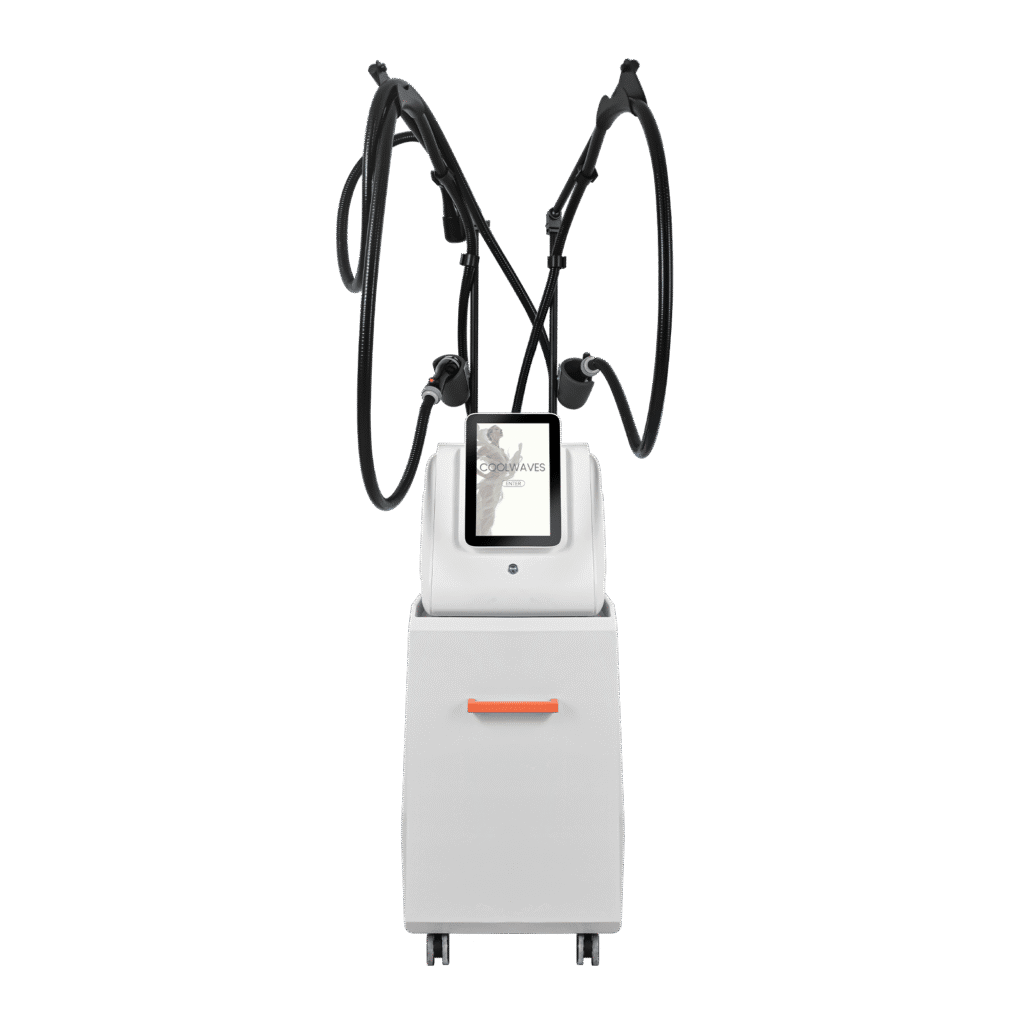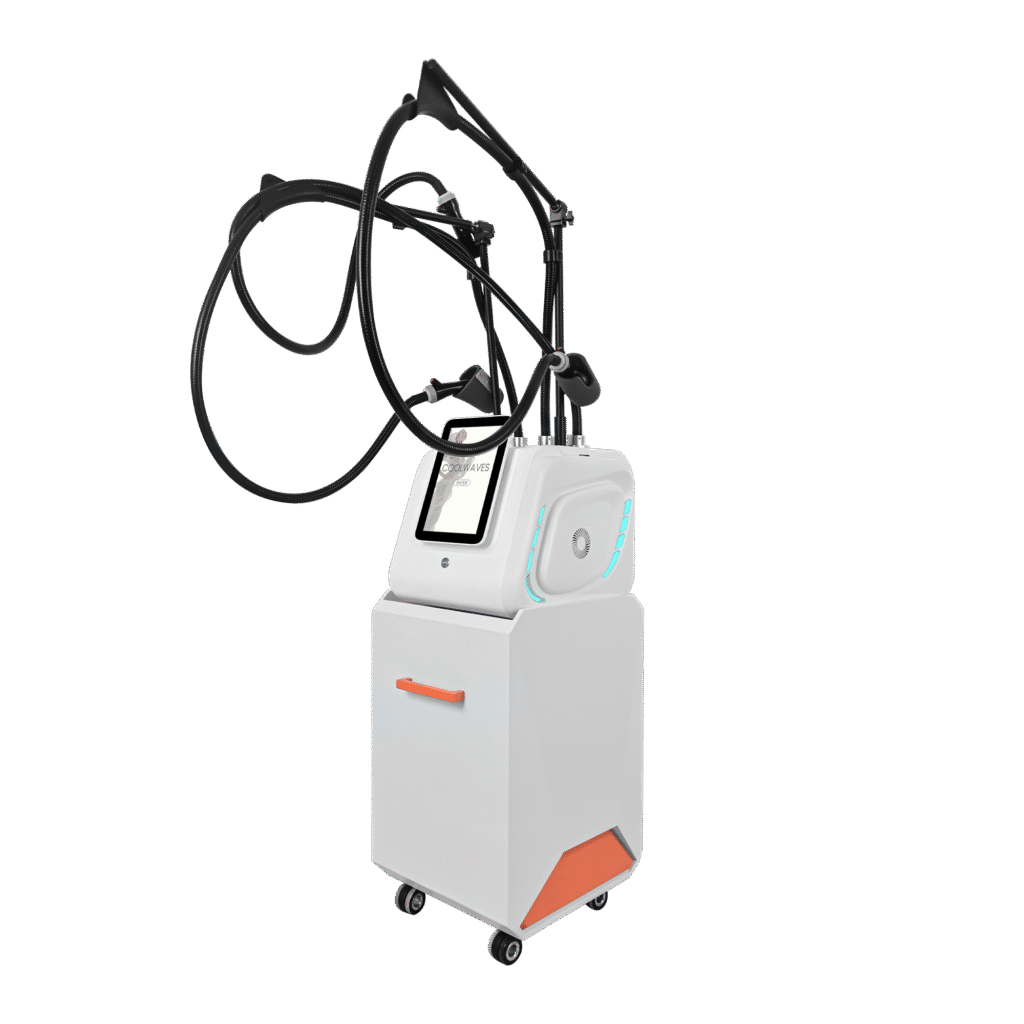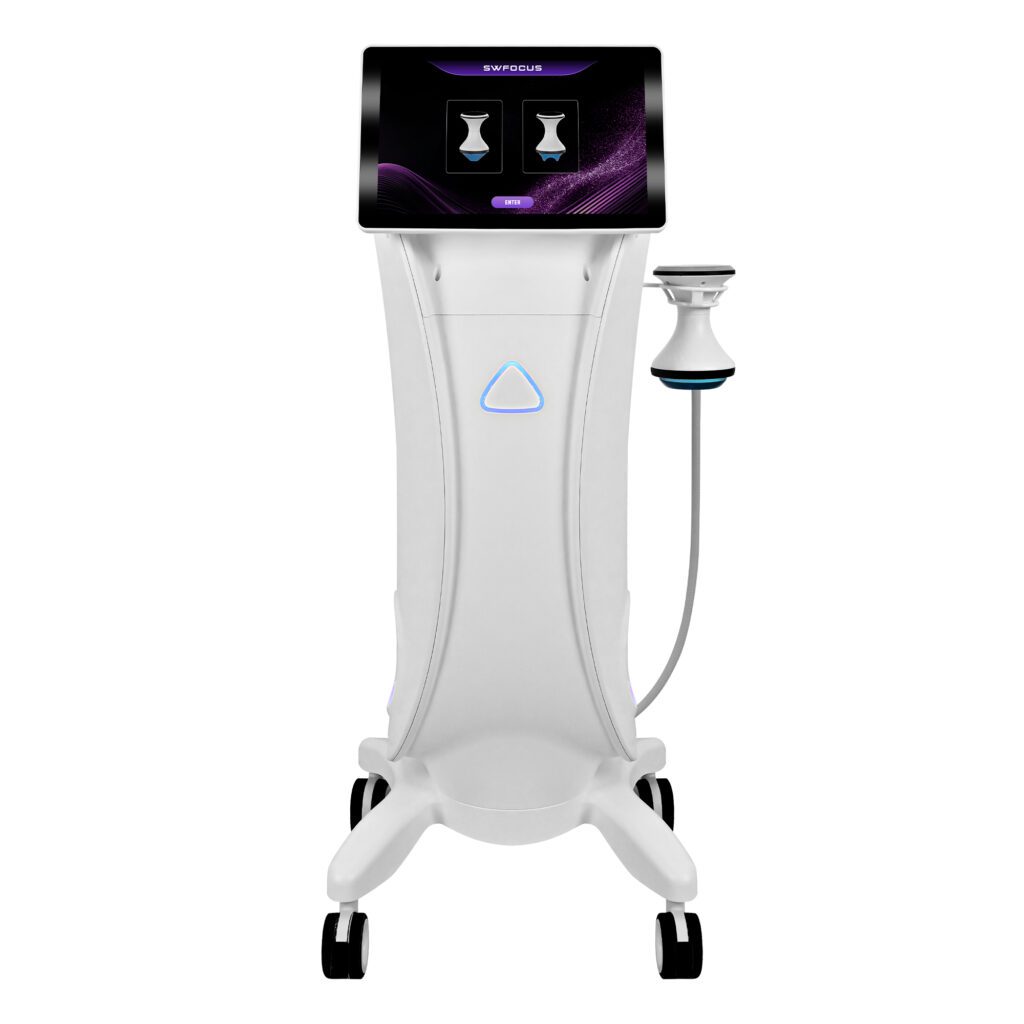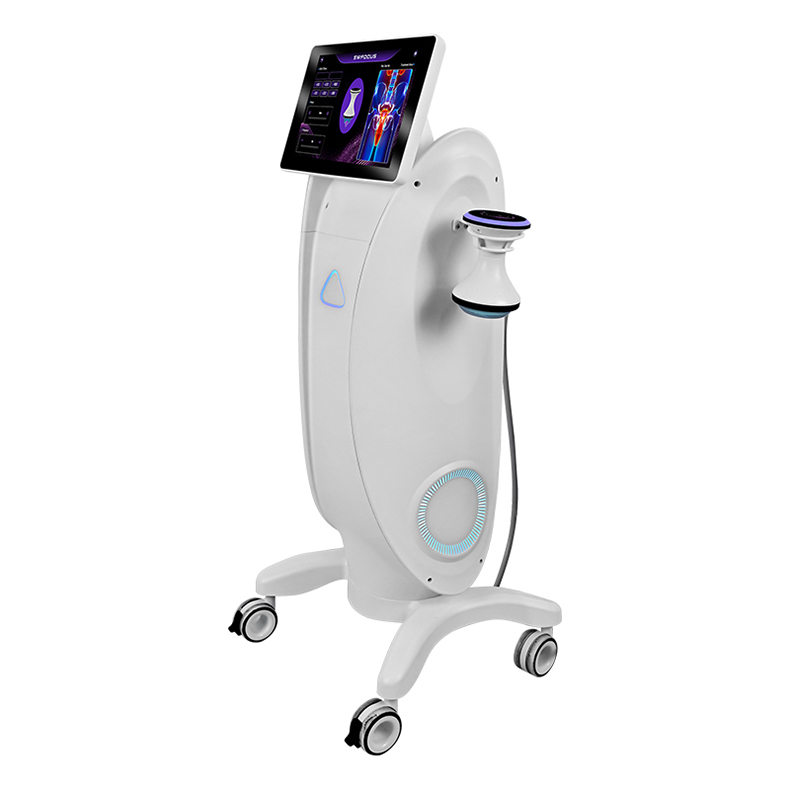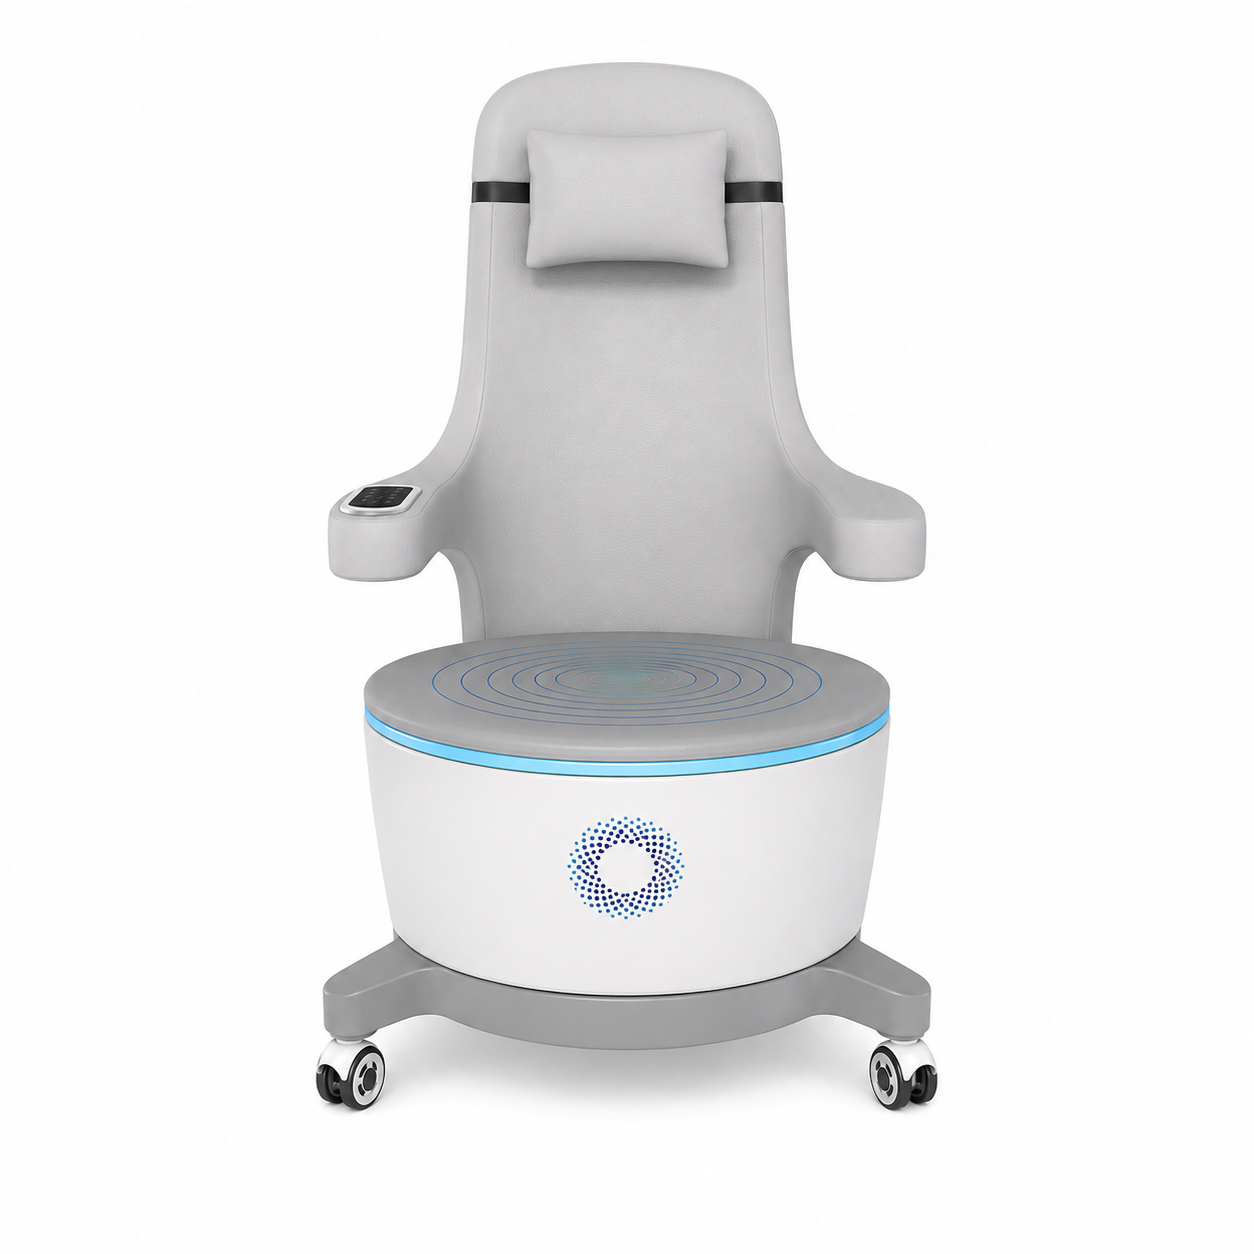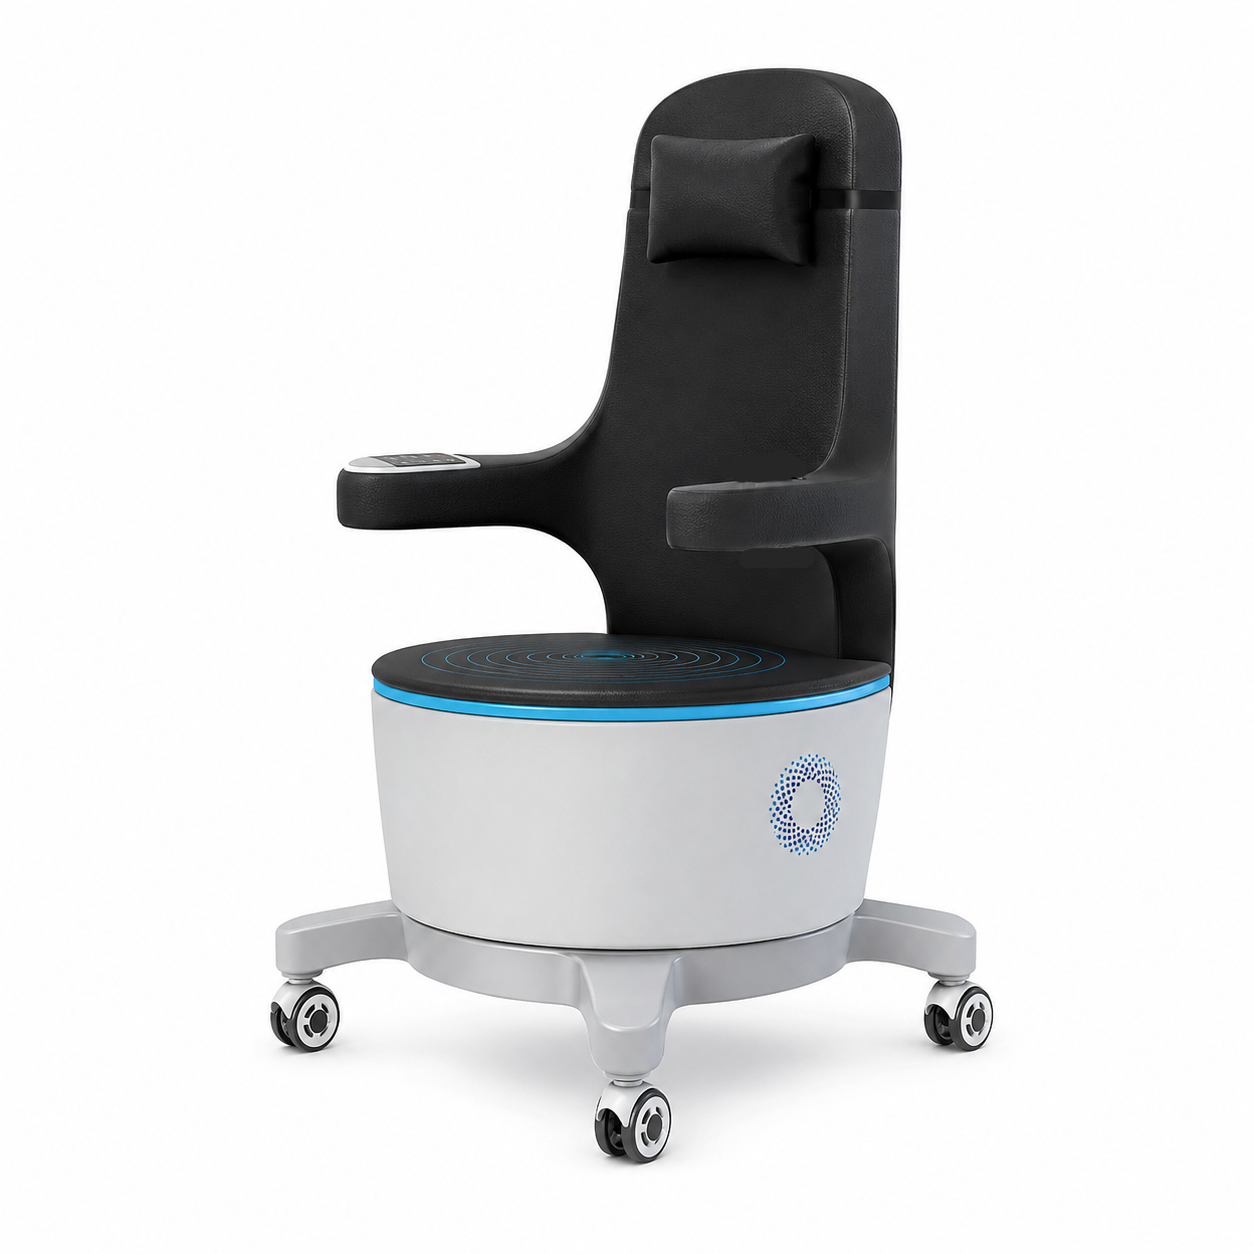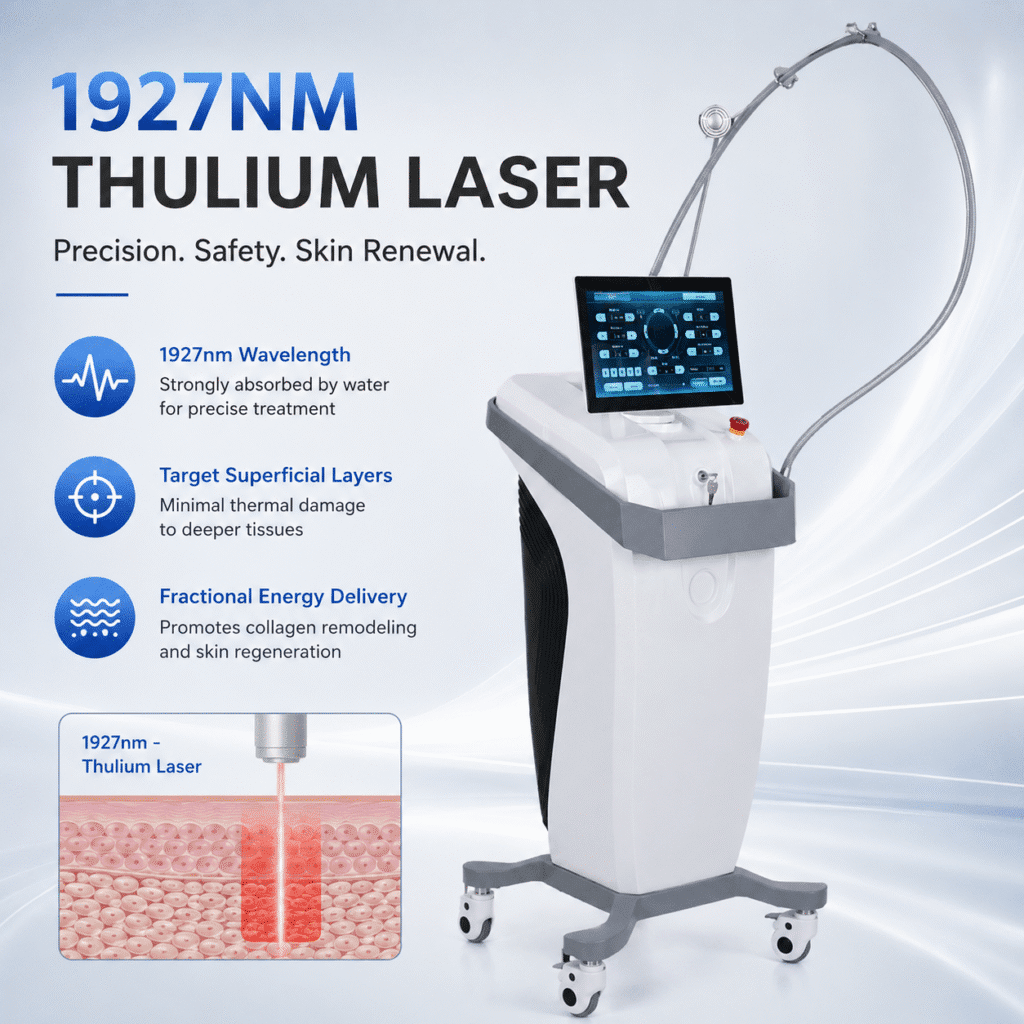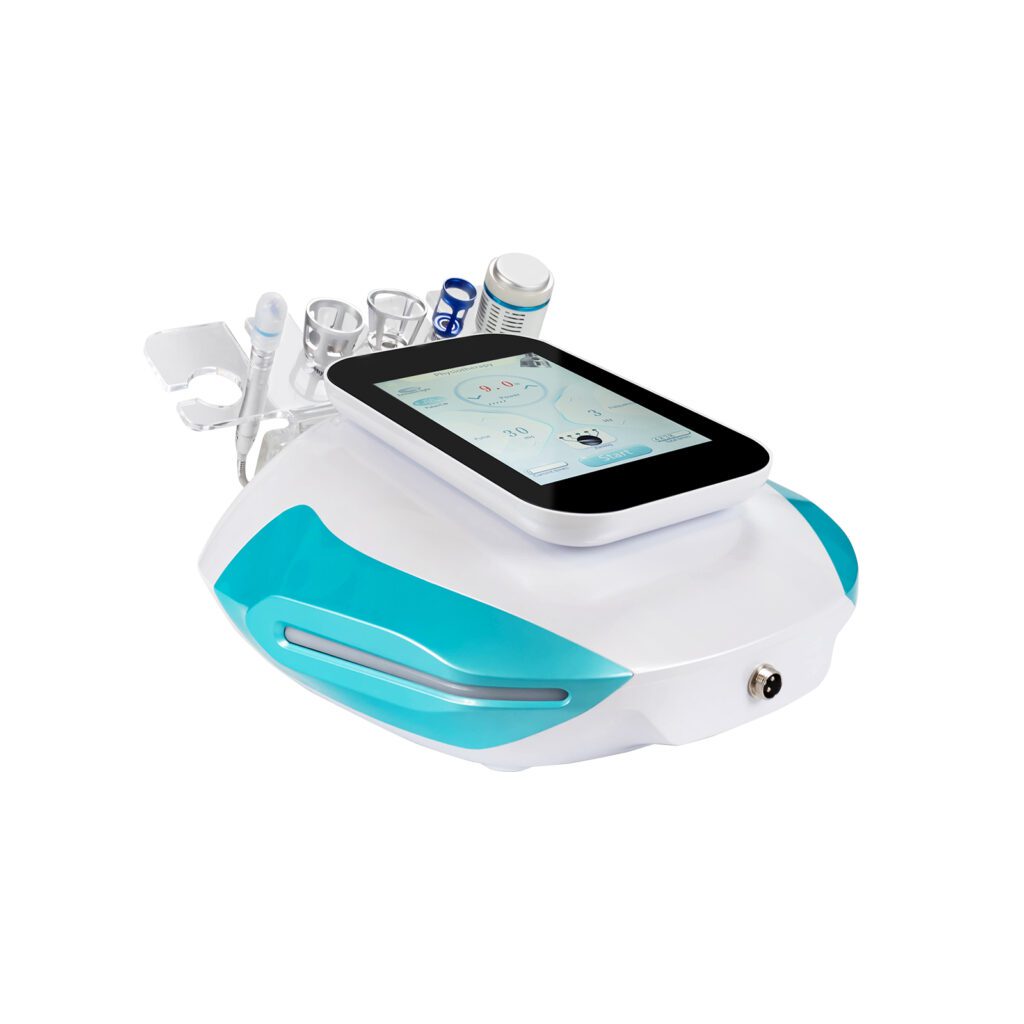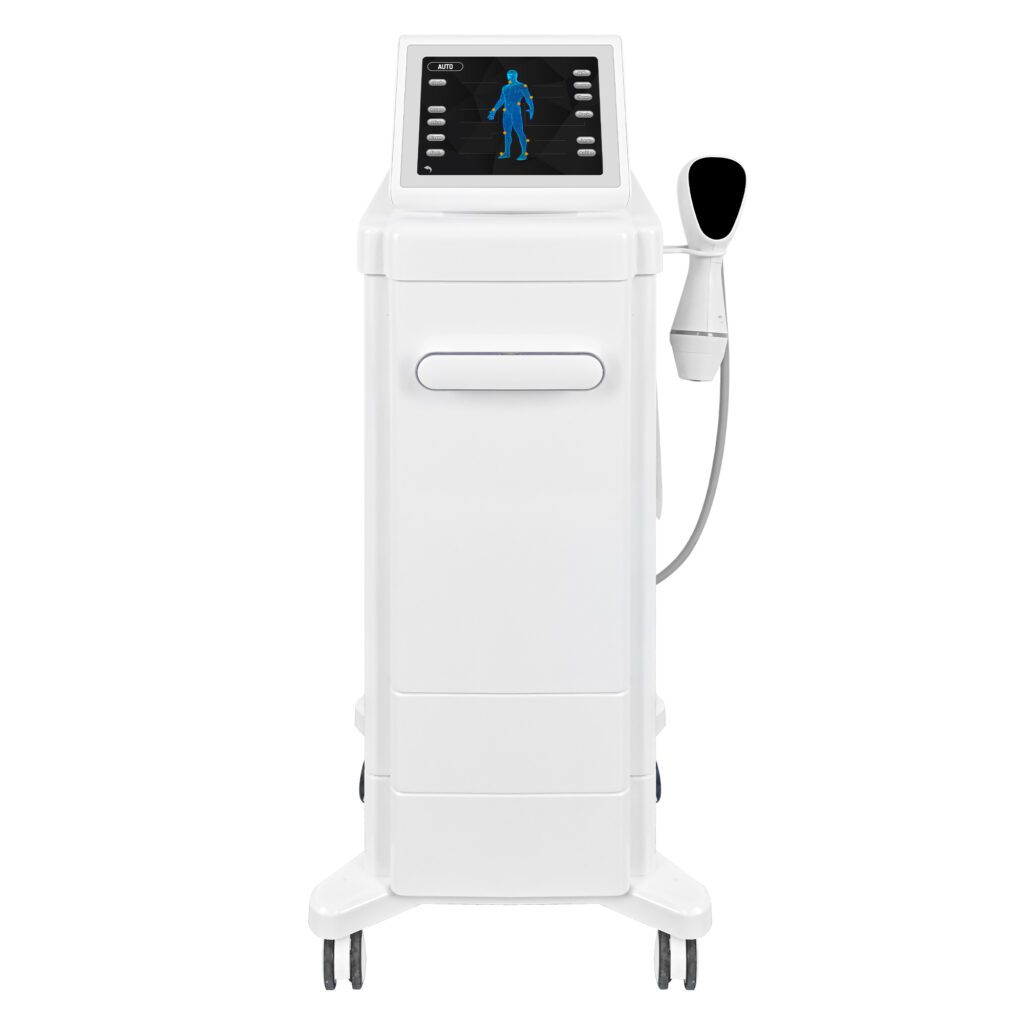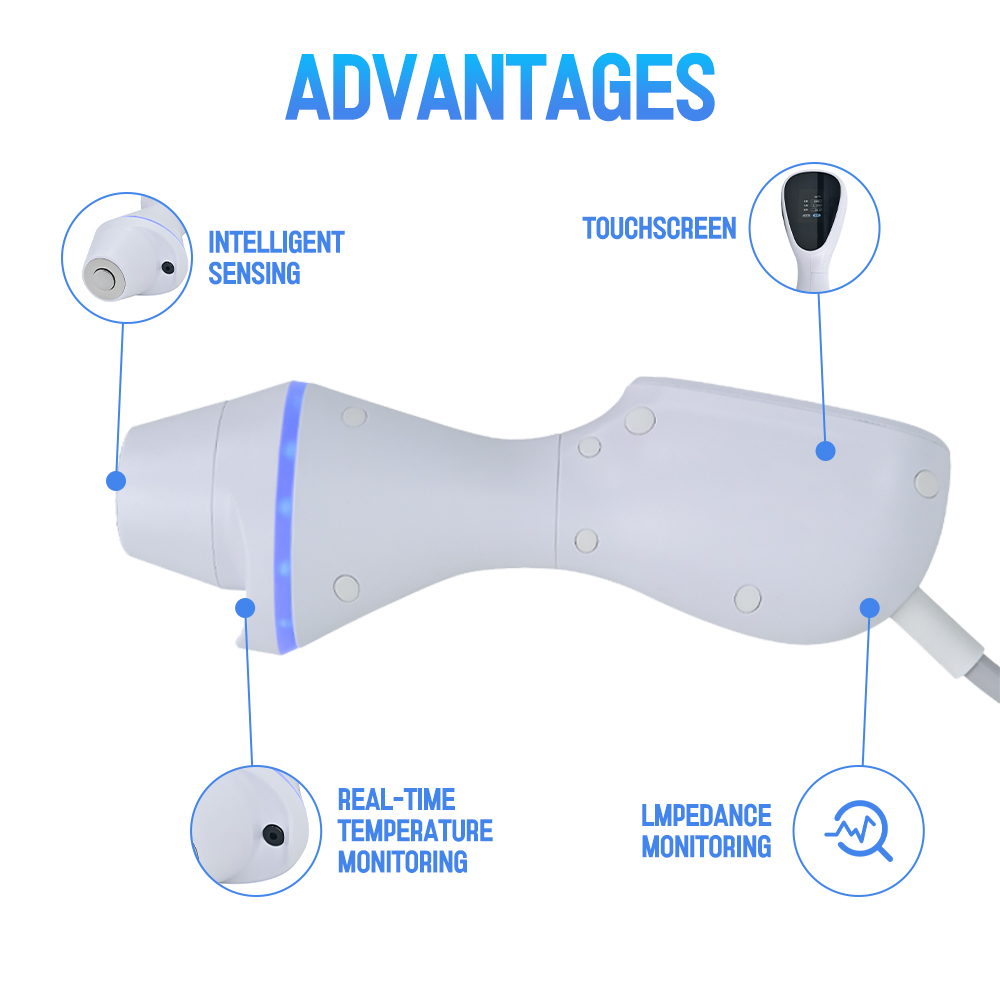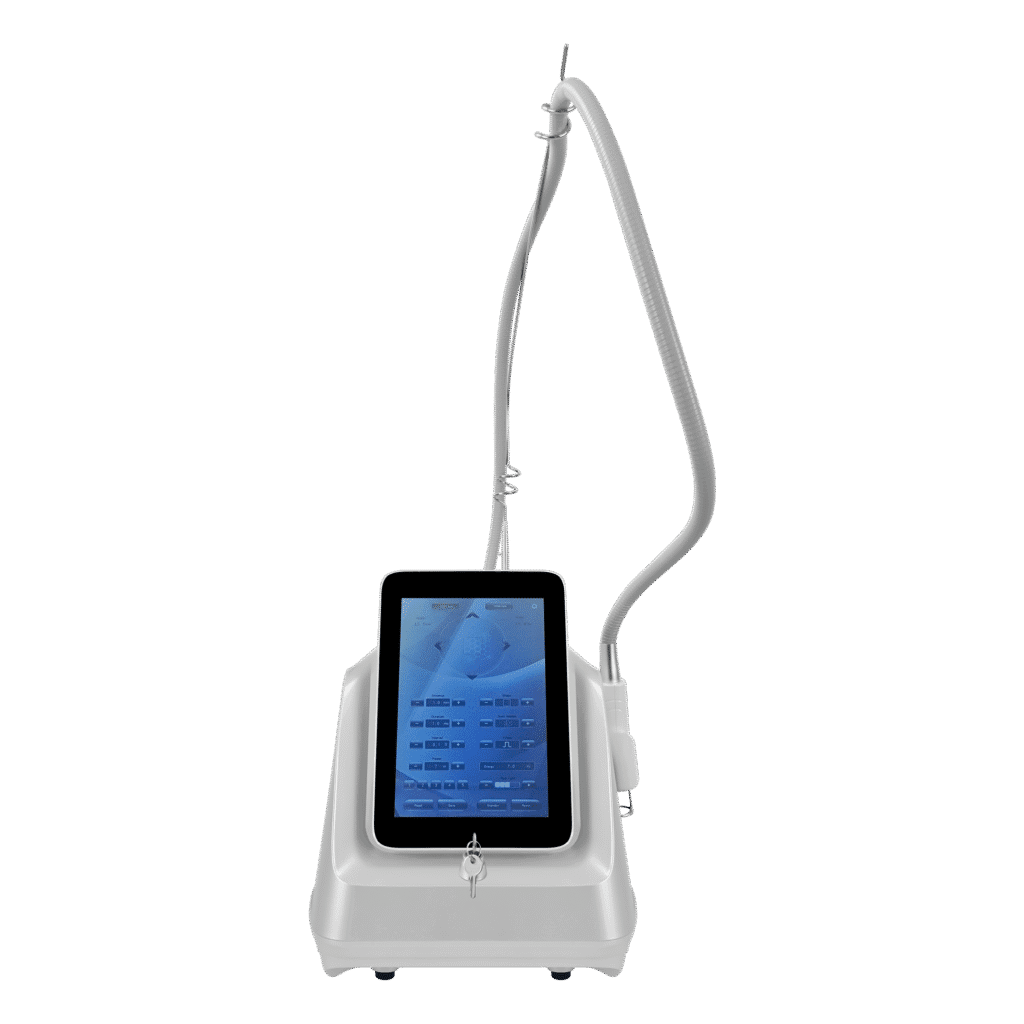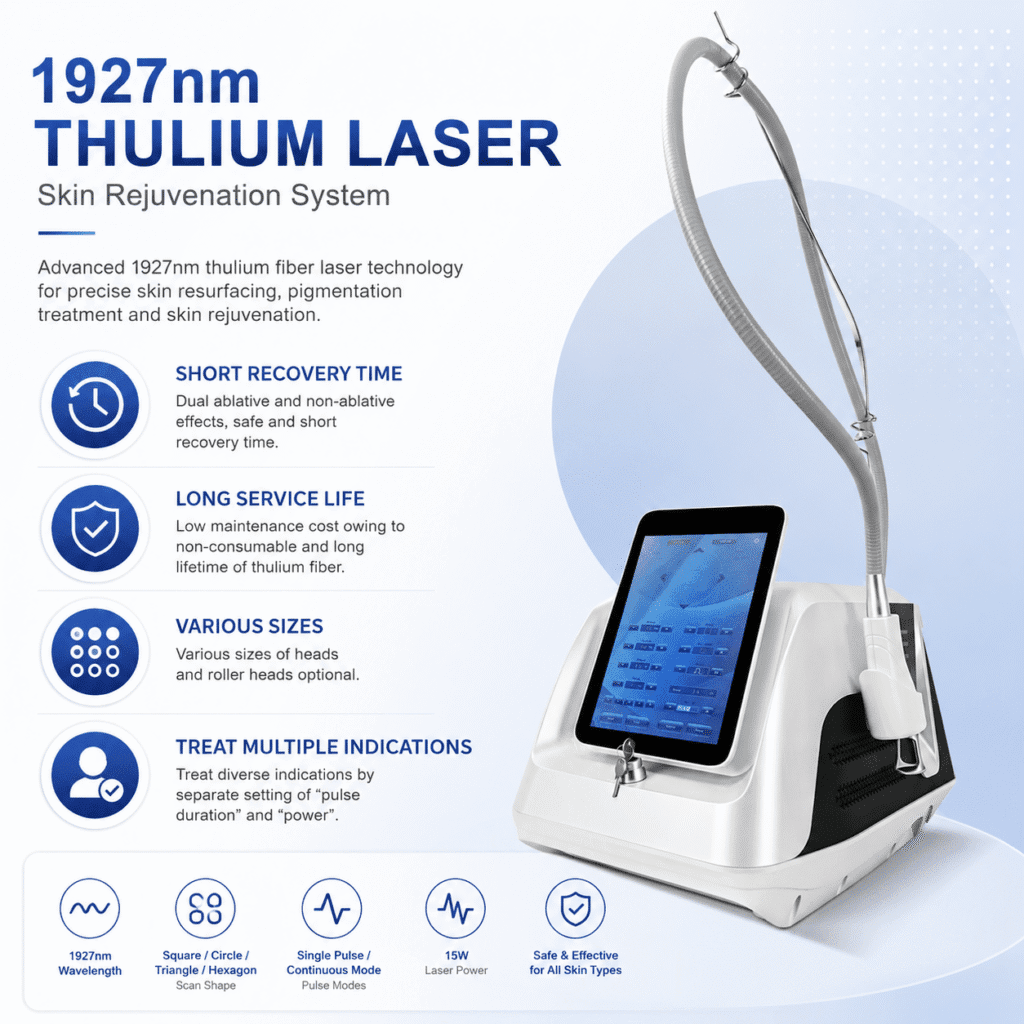
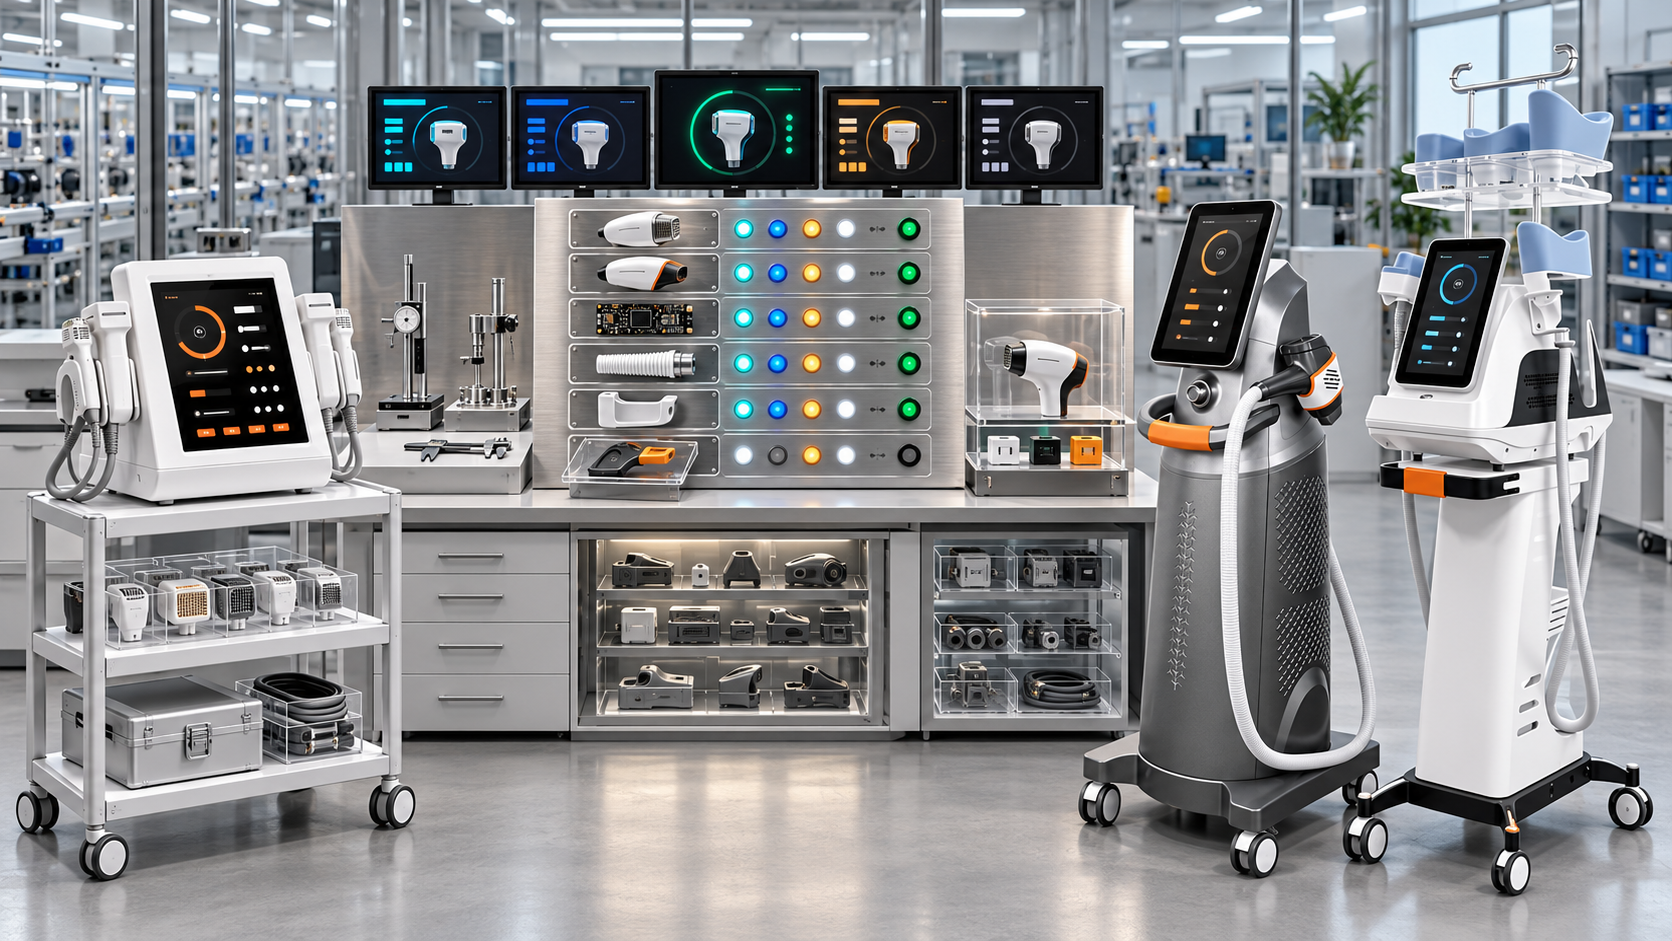
A hydro facial platform, HIFU system, diode laser, microneedling RF device, cryolipolysis machine, EMS body platform, and roller-massage system can all be called beauty devices, but they do not create the same defect opportunities. One depends on pumps, tubing, bottles, vacuum, and cleaning. Another depends on cartridges, handles, recognition, and controlled energy delivery. A third may add optical, cooling, power, and software relationships.
If a factory compares these categories using raw defect counts or one generic failure rate, the result can be misleading. High-volume multifunction devices naturally generate more inspection events. Complex systems expose more components and test steps. Consumable-related cases can distort console reliability. Some problems are detected during production, while others appear only after repeated field use.
This guide explains how factory quality teams can compare defect patterns across beauty device categories without erasing the technical differences that make each category unique.
Sintesi
A reliable cross-category comparison should:
- Use a common core taxonomy. All categories need consistent fields for source, symptom, failure mode, location, cause, severity, detection stage, disposition, and recurrence.
- Add category-specific defect layers. Fluid paths, optical systems, cartridges, applicators, rollers, motors, consumables, and software need different subcodes.
- Choose category-appropriate denominators. Units produced, inspection opportunities, operating hours, treatment cycles, installed handles, cartridges, or component lots may answer different questions.
- Separate product complexity from quality performance. More functions create more opportunities for detection and more records per unit.
- Compare like populations. Model, revision, configuration, supplier, production period, market, and lifecycle stage should be aligned before rates are compared.
- Measure severity and business impact separately from frequency. A common cosmetic defect and a rare control failure should not compete on count alone.
- Distinguish creation from detection. Better inspection can increase recorded defects while reducing escaped problems.
- Link factory and field evidence. Incoming, assembly, test, rework, service, return, complaint, and maintenance data reveal different parts of the pattern.
- Look for shared-platform causes. Power supplies, screens, connectors, cooling modules, software, packaging, and suppliers can create patterns across categories.
- Use comparison to choose actions, not winners. The purpose is to improve controls, designs, suppliers, service, and product decisions, not to declare one category universally better.
The best analysis keeps a common measurement spine while preserving the architecture of each product category.
1. Why Cross-Category Defect Comparison Is Difficult
Beauty device categories differ in:
- number of functions and components;
- energy, fluid, vacuum, motion, cooling, and control architecture;
- durable and disposable accessory relationships;
- inspection coverage and test duration;
- production volume and maturity;
- operator interaction;
- maintenance requirements;
- expected wear mechanisms;
- field-use intensity; and
- regulatory status by product and market.
A defect rate can therefore reflect product architecture, detection design, exposure, data quality, or actual reliability. Quality teams need to separate these effects before making decisions.
2. Start with the Decision Question
Different questions require different comparisons.
Supplier decision
Which categories are affected by one supplier, component, material, or process?
Manufacturing decision
Which category creates the most rework, retesting, line disruption, or inspection burden?
Product decision
Which architecture, configuration, or revision needs improvement?
Service decision
Which category requires more spare parts, diagnostic support, training, or downtime management?
Portfolio decision
Which products should be retained, upgraded, restricted, replaced, or retired?
One dashboard should not answer all five questions with the same metric.
3. Build a Common Core Data Model
Every defect record should include, as applicable:
- event ID and source;
- product category, model, and configuration;
- hardware, software, and parameter revision;
- unit serial, work order, component lot, or accessory identity;
- production or field date;
- symptom and detection condition;
- verified failure mode and location;
- severity and risk reference;
- cause and cause-confidence status;
- containment, correction, and disposition;
- rework, retest, repair, or replacement;
- relazione di ricorrenza;
- labor, delay, scrap, downtime, or service impact; and
- linked corrective action or product change.
This common spine supports cross-category summaries. Category-specific fields can then add the detail required for technical decisions.
4. Separate Symptom, Failure Mode, Location, and Cause
| Data layer | Scopo | Cross-category example |
|---|---|---|
| Sintomo | records what was observed | no output, low suction, error message, unusual noise, overheating |
| Failure mode | states how a requirement was not met | intermittent connection, leakage, drift, blockage, communication timeout |
| Posizione | identifies where failure was confirmed | pump, cable, connector, board, sensor, handle, cartridge, motor, software module |
| Causa | explains why the failure occurred | supplier variation, assembly stress, design margin, incorrect software logic |
| Condizione concomitante | describes factors increasing occurrence | long operation, transport, one revision, one accessory, maintenance state |
Two categories can share a symptom but have different failure modes. Conversely, one connector-retention cause can create different symptoms across categories.
5. Use a Two-Level Taxonomy
The taxonomy should combine universal and category-specific codes.
Universal system layer
- power and protection;
- electronics and control board;
- software and user interface;
- cooling and temperature;
- cable, connector, and communication;
- enclosure and mechanical structure;
- labeling, documentation, and packaging;
- appearance and workmanship;
- accessory completeness; and
- supplier or material status.
Category-specific layer
- fluid and vacuum path;
- optical path and laser delivery;
- HIFU handle and cartridge;
- microneedling handle and tip;
- cryolipolysis applicator and temperature path;
- EMS applicator and stimulation channel;
- roller, motor, vacuum, and mechanical-motion path;
- RF or cavitation handpiece; and
- disposable or consumable interface.
This structure allows quality teams to compare shared electronics across all categories while still investigating a category-specific mechanism.
6. Define the Comparison Unit
A defect event, affected unit, repair action, and service ticket are not the same thing.
One unit can contain:
- several defects;
- repeated observations of one unresolved defect;
- multiple repair attempts;
- one confirmed failure and several symptoms;
- several optional handles with separate results; or
- one complaint that includes multiple allegations.
Define whether each analysis counts events, affected units, defect opportunities, repair touches, parts replaced, or confirmed root causes. Use separate metrics when several perspectives are needed.
7. Choose the Correct Denominator
| Domanda | Useful denominator |
|---|---|
| incoming material quality | units or lots inspected |
| production unit quality | units started, completed, or tested |
| repeated assembly opportunity | connectors, fasteners, channels, tubes, or handles installed |
| field reliability | active device-months or operating hours |
| treatment exposure | treatment cycles or shots where reliable data exists |
| durable accessory reliability | installed handpiece- or applicator-months |
| consumable performance | cartridges, tips, needles, membranes, or other consumables used |
| operational burden | labor hours, retests, downtime, or service visits per unit |
The denominator should match the failure opportunity. A console-level rate can hide an applicator problem, while a per-handle rate can overstate console exposure if the handle population is unknown.
8. Normalize for Product Complexity
Complexity does not excuse poor quality, but it changes the number of opportunities for defects to be detected.
Useful complexity indicators can include:
- number of installed functions;
- number of durable handles or applicators;
- number of fluid, vacuum, cooling, or energy channels;
- software modes and configurations;
- assembly operations;
- inspection and test steps;
- regional variants;
- optional accessories; and
- recurring consumables.
Show both per-unit and per-opportunity views. Do not create a single complexity-adjusted score that hides serious events or becomes impossible to explain.
9. Align Lifecycle Stage
Compare defects detected at the same stage whenever possible:
- ispezione in entrata;
- first-unit or first-article review;
- assembly and in-process inspection;
- software loading and calibration;
- functional and performance testing;
- aging or repeated-operation testing;
- final inspection and packaging;
- trasporto e installazione;
- early field life;
- routine field use; and
- wear, maintenance, or end-of-life period.
A category with strong factory detection may show more internal events and fewer field escapes. Combining both stages into one total can hide that advantage.
10. Separate Creation Rate from Detection Rate
Recorded defects can increase after:
- inspection coverage expands;
- aging duration increases;
- test fixtures improve;
- software logging is enabled;
- acceptance limits change;
- inspectors receive better training;
- previously uncoded symptoms receive controlled codes; or
- service partners begin reporting consistently.
Annotate trend charts with these changes. A rise in detection can be evidence of a stronger control system rather than a worse product.
11. Compare Severity and Frequency Separately
Use at least two views:
Frequency view
Shows which defect families create the highest event or affected-unit rate.
Severity and risk view
Shows potential effect, detectability, field exposure, affected function, and need for escalation.
Operational impact view
Shows rework, scrap, test capacity, shipment delay, repair time, parts use, and customer downtime.
Do not combine all three into one unexplained score. Decision-makers should see why an issue is prioritized.
12. Compare First-Pass Yield with Caution
First-pass yield can reveal manufacturing stability, but category differences matter.
A category with more test steps, more optional functions, or longer aging may create more first-pass opportunities. A simple device may pass initial tests while still generating field issues not represented by the factory sequence.
Pair first-pass yield with:
- defect opportunities;
- failure stage;
- rework time;
- final acceptance;
- field escape rate;
- severity; and
- test coverage.
High final yield after extensive rework is not the same as stable first-pass production.
13. Compare Rework Burden
Traccia:
- affected units;
- repair or rework hours;
- number of touches;
- replacement parts;
- repeated retests;
- engineering support time;
- delay to release;
- scrap; and
- recurrence after rework.
One laser-system issue may consume more specialized engineering time than several cosmetic defects on a facial device. Count alone does not show the resource burden.
14. Compare Field Escape Patterns
Field patterns should distinguish:
- confirmed product defect;
- unconfirmed allegation;
- no fault found;
- installation issue;
- maintenance issue;
- accessory or consumable issue;
- use or training issue;
- transport damage;
- environmental condition; and
- documentation or configuration mismatch.
Category comparison is weak when all service tickets are treated as confirmed product failures.
15. Protect the Analysis from Product Maturity Bias
New and mature categories generate different evidence.
New products may have:
- small populations;
- rapid design changes;
- limited field exposure;
- higher reporting attention; and
- incomplete failure history.
Mature products may have:
- larger installed populations;
- accumulated wear events;
- legacy revisions;
- fragmented service data; and
- more stable production processes.
Show maturity, population, revision, and exposure alongside rates. Do not rank categories by percentage alone when sample sizes differ substantially.
16. Hydra and Fluid-Based Facial Devices
IL Categoria SHEFMON Hydra includes multifunction facial systems such as the A0648.
Relevant analytical layers can include:
- pump and vacuum performance;
- tubing, bottle, valve, filter, and seal integrity;
- leakage and blockage;
- flow and suction stability;
- handle and tip fit;
- solution-path cleaning;
- connector and accessory completeness;
- software and control behavior;
- cosmetic workmanship; and
- maintenance or fluid-related condition.
Useful denominators include units produced, fluid-path assemblies, pumps installed, functional cycles, and treatment or cleaning cycles where reliable data is available.
17. HIFU and Cartridge-Based Systems
IL SHEFMON HIFU category includes configurations with different handles, cartridges, and combined functions.
Category-specific analysis can separate:
- console and control board;
- handle and connection;
- cartridge identity and recognition;
- shot or usage count;
- cooling and temperature behavior;
- software and parameter profile;
- output verification;
- RF or EMS modules where included;
- accessory compatibility; and
- cartridge or handle replacement history.
Compare console-level, handle-level, and cartridge-level patterns separately. A consumable issue should not automatically reduce the apparent reliability of the base console.
18. Laser and IPL Systems
IL SHEFMON Laser and IPL category includes diode, YAG, fractional, fiber, and other platforms with different architectures.
Analytical layers can include:
- power supply and control;
- optical or energy-delivery path;
- handpiece and spot-size configuration;
- wavelength configuration;
- cooling and flow;
- calibration and output verification;
- interlocks and protective functions;
- software, parameter, and error logs;
- consumable or replaceable optical components; and
- regional electrical configuration.
Do not combine all laser systems into one defect rate. Compare similar technology, configuration, inspection coverage, and use exposure first.
19. MNRF Microneedling Systems
IL SHEFMON MNRF Microneedling category requires separation of durable and disposable components.
Track, as relevant:
- console and software;
- durable handle;
- needle-tip type and lot;
- tip installation and recognition;
- depth or movement mechanism;
- RF-related control;
- connector and cable;
- single-use component condition;
- cleaning or contamination control; and
- consumable compatibility.
A needle-tip event rate should use tips used or installed, while a handle reliability rate should use installed-handle exposure.
20. Cryolipolysis Systems
IL Categoria di criolipolisi SHEFMON includes focused and combination platforms.
Category-specific defect families can include:
- applicator and cable;
- temperature sensing and control;
- vacuum path where applicable;
- membrane, cover, or consumable interface;
- contact and positioning;
- connector and recognition;
- software and alarms;
- cooling module;
- enclosure and mobility; and
- multi-applicator interaction.
Use console, installed-applicator, treatment-cycle, and consumable denominators according to the question. Combination systems should retain function-specific records.
21. EMSlim and Muscle-Stimulation Platforms
IL Categoria SHEFMON EMSlim includes body and face stimulation-style configurations, some with additional RF-related functions.
Analytical layers can include:
- applicator and channel;
- cable and connector;
- applicator recognition;
- cooling and temperature where applicable;
- RF-related module where included;
- software, modes, and parameters;
- strap or positioning accessories;
- power and control stability;
- treatment-cycle exposure; and
- applicator replacement history.
Compare events by installed applicator and channel as well as by console. One console can create several independent exposure opportunities.
22. Endos Velapro and Roller-Massage Systems
IL SHEFMON Endos Velapro categoria includes desktop and vertical platforms with different handle combinations.
Relevant patterns can include:
- roller, sphere, or rotating mechanism;
- motor and drive;
- vacuum path;
- handle, cable, and connector;
- RF or light-related module where included;
- noise and vibration;
- wear components;
- cleaning and maintenance;
- software and mode control; and
- actual handle package.
Expected wear, maintenance replacement, premature failure, and manufacturing defect should be coded separately.
23. RF Cavitation and Multifunction Body Systems
IL SHEFMON RF Cavitation category can combine RF, cavitation, lipolaser, EMS, vacuum, or other functions depending on the product.
Quality teams should analyze:
- base console and shared power;
- each functional board;
- individual handles;
- cables and connectors;
- cooling or contact requirements;
- software mode and parameter control;
- shared-resource interaction;
- accessory completeness;
- function-specific inspection; and
- multi-function aging or simultaneous-load conditions where applicable.
A single multifunction rate can conceal one weak handle or board while making the whole platform appear unstable.
24. Compare Category Detection Profiles
| Categoria | Common factory detection opportunities | Possible later-use evidence |
|---|---|---|
| Idra | leak, flow, vacuum, function, accessory and aging checks | cleaning, blockage, seal, tubing and pump behavior over use |
| HIFU | handle, cartridge, recognition, control, cooling and output-related checks | cartridge exposure, connection, software and repeated-use patterns |
| Laser/IPL | power, cooling, flow, control, optical/output and protective-function checks | long-run cooling, handpiece, field environment and maintenance patterns |
| MNRF | handle, movement, tip recognition, RF-related and function checks | tip compatibility, installation, handle wear and consumable patterns |
| Criolipolisi | applicator, temperature, vacuum, control and alarm checks | treatment-cycle, contact, applicator and consumable exposure |
| EMSlim | channel, applicator, cable, recognition and mode checks | applicator-cycle, positioning, connector and repeated-use patterns |
| Endos/RF body | motor, roller, vacuum, handle, function and noise checks | wear, cleaning, maintenance, cable and mechanical-use patterns |
These are analytical examples, not claims about actual SHEFMON defect history.
25. Find Shared Causes across Categories
Cross-category analysis is especially valuable for common elements:
- power supplies;
- control boards;
- screens and touch interfaces;
- fans and cooling modules;
- pumps and vacuum components;
- cables and connectors;
- sensors;
- casters and enclosure hardware;
- software frameworks;
- labels, manuals, and package components;
- suppliers and manufacturing sites; and
- test equipment and fixtures.
If several categories show different symptoms but share one component lot, supplier process, connector family, or software module, a platform-level corrective action may be more effective than separate model actions.
26. Separate Shared Components from Shared Failure Mechanisms
The same part can fail for different reasons in different products.
A connector may experience:
- routing stress in one category;
- repeated user connection in another;
- transport vibration in a third;
- heat exposure in a fourth; or
- incorrect assembly at one station.
Shared part identity is a signal for investigation, not proof of one universal root cause.
27. Build a Cross-Category Comparison Matrix
| Comparison dimension | Required control |
|---|---|
| population | model, configuration, revision and time period |
| exposure | units, opportunities, hours, cycles, handles or consumables |
| detection | stage, coverage, method and acceptance criteria |
| event definition | symptom, confirmed failure, affected unit or repair touch |
| severity | common severity logic with category-specific technical review |
| maturity | production volume, field age and installed population |
| complexity | functions, handles, channels and test opportunities |
| data quality | missing identities, unknown causes and no-fault-found rate |
| impact | rework, scrap, delay, downtime, parts and engineering effort |
| recurrence | first event, repeat event, post-action recurrence and legacy exposure |
The matrix should accompany any category ranking or management summary.
28. Use a Layered Dashboard
Layer 1: executive comparison
- affected-unit rate;
- severity distribution;
- field escape rate;
- rework and downtime;
- recurring issue families; and
- open corrective actions.
Layer 2: category profile
- top defect systems;
- stage of detection;
- model and revision pattern;
- supplier and component pattern;
- handle or consumable exposure; and
- configuration-specific trend.
Layer 3: technical evidence
- individual records;
- raw results and logs;
- component lots;
- failure analysis;
- rework and retest;
- service history; and
- corrective action effectiveness.
Users should be able to move from a cross-category summary to the underlying evidence without losing definitions.
29. Protect against Data-Quality Bias
Categories with better traceability can appear worse because more events are correctly recorded.
Track data quality through:
- missing serial or configuration;
- unknown component lot;
- uncoded symptom;
- unverified failure mode;
- unknown cause;
- no-fault-found percentage;
- missing exposure denominator;
- inconsistent service-part identity;
- incomplete rework history; and
- delayed or duplicate reporting.
Display data completeness beside defect rates. Weak data should reduce confidence, not create a false impression of good quality.
30. Use Statistical Methods Proportionately
Depending on volume and data type, teams may use:
- Pareto charts;
- run charts;
- control charts;
- rate comparisons;
- confidence intervals;
- change-point review;
- cohort analysis;
- survival or time-to-event methods;
- stratified analysis; and
- regression or other multivariable methods.
The method should fit the question and data quality. A sophisticated model cannot repair inconsistent defect definitions or missing exposure.
31. Convert Patterns into Actions
Cross-category findings can support:
- supplier development or source change;
- incoming inspection revision;
- process and fixture improvement;
- standardized connector, cable, cooling, or software architecture;
- category-specific inspection expansion;
- diagnostic and logging improvement;
- training and documentation changes;
- spare-parts and service planning;
- design revision;
- configuration restriction;
- platform upgrade; or
- model retirement and successor planning.
Select the action according to verified cause and affected scope. A high rate does not automatically justify discontinuing a category.
32. Review Patterns at Several Cadences
Daily or shift review
Contain active material, production, and test issues.
Weekly technical review
Examine recurring defects, supplier lots, rework, investigation status, and immediate cross-model implications.
Monthly category review
Compare normalized trends, field escapes, operational burden, and corrective action effectiveness.
Quarterly or stage-gate portfolio review
Review shared architecture, supplier strategy, product upgrades, test investment, service capacity, and lifecycle decisions.
The cadence should reflect severity, volume, reporting latency, and change activity.
33. Common Cross-Category Comparison Mistakes
Ranking raw defect totals
High-volume categories usually generate more events.
Using one denominator for every category
Units produced may not represent handle, cartridge, treatment-cycle, or consumable exposure.
Combining all laser or body systems
Different technologies and configurations can have fundamentally different architectures.
Treating every ticket as a confirmed defect
Installation, maintenance, use, transport, documentation, and no-fault-found cases need separate statuses.
Ignoring inspection coverage
The category with better detection may appear worse internally while creating fewer field escapes.
Hiding severity in a composite score
Managers should see high-severity low-frequency issues directly.
Ignoring product maturity
New and mature categories require different uncertainty treatment.
Comparing consoles while ignoring accessories
Handles, applicators, cartridges, tips, and consumables can dominate category workload.
34. Cross-Category Defect Analysis Checklist
Before comparing categories, confirm:
- The business or technical decision is defined.
- A common core taxonomy is in use.
- Each category has appropriate technical subcodes.
- Event, affected unit, repair touch, and root cause are separated.
- Model, revision, configuration, and time period are aligned.
- Detection stage and inspection coverage are visible.
- Numerators and denominators match each question.
- Product complexity and defect opportunities are shown.
- Production volume, maturity, and field exposure are included.
- Severity is reviewed separately from frequency.
- Rework, scrap, delay, downtime, and service burden are measured.
- Consumables and durable accessories are separated from consoles.
- No-fault-found and unconfirmed events remain visible.
- Shared components and suppliers are analyzed across categories.
- Common parts are not assumed to have common causes without evidence.
- Data completeness is reported.
- Small samples show counts and uncertainty.
- Findings lead to named actions, owners, and effectiveness measures.
Domande frequenti
1. Can a factory compare beauty device categories using raw defect counts?
Raw counts show workload but not relative performance. Use appropriate exposure, configuration, maturity, detection, severity, and data-quality context.
2. What is the best denominator for cross-category comparison?
There is no universal denominator. Units produced can support one view, while component opportunities, operating hours, treatment cycles, installed handles, or consumables may better represent another failure mechanism.
3. Should consumable problems be included in console defect rates?
Keep them linked but separate. Consumable, handle, applicator, and console metrics answer different questions and should not be merged without explanation.
4. Why can a category with more internal defects still be performing well?
It may have stronger inspection coverage that detects problems before shipment. Compare internal detection with field escapes and final product performance.
5. How should new categories with small samples be compared?
Show actual numerator, denominator, configuration, severity, and uncertainty. Avoid precise rankings based on unstable percentages.
6. Can Hydra, HIFU, and laser defects use the same taxonomy?
They can share universal system codes, but each needs category-specific layers for fluid paths, cartridges, optical delivery, cooling, consumables, and other architecture-specific elements.
7. How can factories identify a platform-level issue?
Search across categories for shared components, suppliers, interfaces, software modules, test equipment, or process steps, then verify whether the same failure mechanism applies.
8. Should no-fault-found cases be excluded?
No. Analyze them separately. A high rate can indicate intermittent behavior, missing logs, inadequate reproduction methods, accessory issues, or weak service data.
9. How often should category defect patterns be reviewed?
Use daily containment, weekly technical review, monthly category analysis, and periodic portfolio review, adjusted for severity, volume, reporting delay, and active changes.
10. What public quality information does SHEFMON provide?
IL SHEFMON quality-control page describes incoming material testing, circuit-board aging and power testing, functional aging, inspection, and ERP management. Buyers discussing category-level quality evidence should contattare SHEFMON with the models, configurations, production period, inspection scope, and comparison questions.
Conclusione
Factory quality teams can compare defect patterns across beauty device categories only when they preserve both common definitions and category-specific architecture. Raw counts, generic failure rates, and model-level summaries cannot fairly compare fluid-based facial systems, cartridge platforms, lasers, microneedling RF, cryolipolysis, EMS, and mechanical body devices.
The strongest comparison aligns populations, uses meaningful exposure, separates severity from frequency, shows detection coverage, measures operational impact, protects small samples, and connects production with field evidence. It also searches across categories for common components and processes without assuming that a shared part always has one shared cause.
Esplora il SHEFMON beauty-machine portfolio and its Idra, HIFU, Laser e IPL, MNRF, Criolipolisi, EMSlim, Endos Velapro, E Cavitazione RF categories. For configuration-specific quality questions, contattare SHEFMON with the relevant model, revision, option set, inspection stage, exposure, and evidence needed.