









Beauty-device portfolios are often expanded, reduced, or upgraded using sales volume and product specifications. Those inputs matter, but they do not show which configurations create repeated support work, which maintenance tasks prevent disruption, which replacement components deserve stock, or which older models are becoming difficult to support.
Fault and maintenance data can improve these decisions when it is connected to the exact installed device, configuration, component, service event, and outcome. Raw complaint counts are not enough. A widely installed model may generate more tickets while having a lower incident rate than a small fleet. This guide explains how salons, clinics, med spas, and distributors can turn reliable support records into evidence for professional beauty-device portfolio decisions.
요약 보고서
- Build unit-level records before comparing models or categories.
- Separate reported symptoms, verified faults, contributing conditions, root causes, maintenance actions, and final outcomes.
- Normalize incident counts by active installed exposure, such as device-months, instead of using raw totals alone.
- Segment results by model, configuration, revision, handle or module, market, site type, and equipment age.
- Track downtime, recurrence, service effort, replaced components, preventive maintenance, and unresolved cases alongside incident rate.
- Distinguish equipment problems from setup, consumable, cleaning, environment, training, and documentation issues.
- Use consistent severity rules and stop-use criteria for high-energy, electrical, cooling, or professional-use equipment.
- Convert findings into specific decisions: retain, monitor, improve training, revise maintenance, adjust parts coverage, restrict a configuration, upgrade, or retire.
- Treat small samples and incomplete records as uncertain rather than declaring a model better or worse.
- Review current SHEFMON models by exact configuration and installed evidence; do not publish unsupported reliability rankings.
1. Which Portfolio Decisions Can the Data Support?
Fault and maintenance records can inform decisions at several levels.
Product-category decisions
- whether a business is ready to support facial, RF-microneedling, HIFU, laser, or body-care equipment;
- which categories require more technical resources;
- where central support or regional specialists are needed.
Model and configuration decisions
- which configurations should remain core offers;
- which options create avoidable identification or support complexity;
- whether a revised package should replace an older combination;
- which legacy configurations still require support.
Component decisions
- which handles, cartridges, applicators, cables, or accessories drive cases;
- which replacements need local, regional, or supply-to-order coverage;
- which consumables or maintenance items need clearer identification.
Operational decisions
- where training, documentation, setup checks, preventive maintenance, or escalation needs improvement;
- which cases can be triaged remotely and which require technical service;
- whether service records and installed-unit data are complete enough to support reliable decisions.
The data should lead to an identified action, owner, and review date rather than a broad label such as “good model” or “problem model.”
2. What Fault Data Cannot Prove by Itself
Support records do not automatically establish:
- clinical performance;
- treatment effectiveness;
- inherent product reliability;
- safety across every market and use condition;
- the cause of an incident before technical review;
- future failure probability for a specific unit;
- superiority over a competitor;
- profitability or return on investment.
A ticket can begin with “handle not working” and end with a loose connection, incorrect consumable installation, configuration mismatch, maintenance omission, power issue, damaged cable, verified component fault, or unresolved cause. Keep the initial symptom separate from the final finding.
3. Create a Unit-Level Data Model
Portfolio analysis should connect several record types.
| 기록 | Key purpose | Essential identifiers |
|---|---|---|
| Installed unit | Defines the equipment population | Unit ID, model, configuration, revision, site, status |
| Installed component | Shows what each device actually carries | Component ID, handle/module, revision, installation date |
| Incident | Captures an abnormal report or interruption | Incident ID, unit ID, symptom, date, severity, status |
| Diagnostic event | Records checks and findings | Test, evidence, reviewer, result, date |
| Maintenance event | Records planned or corrective work | Task, unit/component, authorization, completion, outcome |
| Replacement event | Shows removed and installed items | Old component, new component, compatibility revision, date |
| Downtime interval | Measures unavailable time under a defined rule | Start, end, reason, partial or complete impact |
| Case outcome | Closes the operational loop | Resolution, root-cause status, recurrence flag, follow-up |
One service ticket can contain several diagnostic and maintenance events. Keep them connected without merging their meanings.
4. Use Stable Device and Component Identities
Every record should resolve to:
- official model number;
- sellable configuration code;
- hardware or software revision where relevant;
- installed-unit or serial identifier;
- 시장 및 전기 프로필;
- installed handle, cartridge, applicator, or controlled accessory;
- customer site and servicing region;
- lifecycle state;
- source and confidence of the identity.
Avoid analyzing entries such as “hydro machine,” “laser handle,” or “HIFU cartridge” as if they represent one technical population. Unresolved identity should become a data-quality issue, not an assumed model assignment.
5. Build a Consistent Fault Taxonomy
A practical taxonomy separates what was observed from what was confirmed.
Reported symptom
What the user saw or experienced, such as no power, handle not recognized, weak suction, abnormal sound, error message, unstable cooling, leakage, or damaged cable.
Affected function
The part of the service menu or device operation that was interrupted, such as hydro flow, RF handle, HIFU cartridge, laser handle, body applicator, screen, vacuum, or software access.
Verified fault location
Main unit, handle, applicator, cable, connector, cartridge, consumable, fluid path, cooling system, electrical input, software, accessory, or unknown.
Contributing condition
Incorrect setup, cleaning gap, environmental condition, incompatible item, installation issue, transport damage, user operation, overdue maintenance, or insufficient evidence.
Root-cause status
Confirmed, probable, unresolved, duplicate report, no fault found, or outside scope.
Do not force every case into a confirmed root cause. An honest Unknown category is more useful than inaccurate precision.
6. Separate Maintenance Types
Different maintenance events answer different questions.
| Maintenance type | 의미 | Portfolio use |
|---|---|---|
| Routine operator care | Cleaning, inspection, storage, and approved external checks | Tests whether basic procedures are clear and completed |
| 예방 정비 | Scheduled work intended to maintain the approved operating condition | Compares completion with later incident patterns |
| Condition-based maintenance | Work triggered by observed wear, count, status, or inspection | Helps define practical intervention signals |
| Corrective maintenance | Work performed after a verified problem | Shows repair effort, components, and downtime |
| 구성 변경 | Approved handle, module, software, or component change | Prevents mixing pre-change and post-change data |
| Service campaign or focused review | Targeted action for an identified population | Measures reach, completion, and remaining exposure |
Do not classify normal consumable replacement as equipment failure. Also avoid hiding repeated corrective work under a general “maintenance completed” label.
7. Capture a Minimum Incident Dataset
The report form should be short enough to complete and structured enough to analyze.
Minimum fields include:
- incident ID;
- report date and event date;
- installed-unit ID;
- model, configuration, and revision;
- site and region;
- component or function affected;
- reported symptom;
- operating state when the issue appeared;
- severity;
- stop-use decision;
- photos, video, error information, or other evidence;
- initial triage result;
- diagnostic actions;
- verified finding or root-cause status;
- maintenance or replacement action;
- component IDs removed and installed;
- downtime start and end under the defined policy;
- closure date and resolution;
- recurrence relationship;
- responsible support owner.
Use customer or appointment codes where needed and control access to personal data. Portfolio analytics rarely require identifiable treatment-client information.
8. Choose the Correct Exposure Denominator
Raw counts favor small fleets and penalize widely installed models. Normalize incidents with a denominator that reflects opportunity for an event.
Active device-months
Useful when reliable usage hours or service counts are unavailable.
Incident rate per 100 active device-months = Verified incidents ÷ Active device-months × 100
One device active for 12 months contributes 12 device-months. A device temporarily inactive should contribute only according to the organization’s documented rule.
Operating hours
Useful when the system captures accurate and comparable operating time.
Incident rate per 1,000 operating hours = Verified incidents ÷ Operating hours × 1,000
Service or treatment cycles
Useful for components whose exposure follows actual use, provided cycle data is consistent and appropriate for the device.
Installed component-months
Useful for handles or applicators when one console can carry different quantities.
Choose one primary denominator for each analysis and document its limitations. Do not compare one model by device-months and another by treatment cycles in the same ranking.
9. Calculate Core Portfolio Metrics
Use a group of metrics rather than one failure rate.
| 미터법 | Example definition | Decision supported |
|---|---|---|
| Verified incident rate | Verified incidents divided by exposure | Compares normalized support demand |
| Severe incident rate | High-severity verified incidents divided by exposure | Prioritizes technical review and stop-use controls |
| Repeat-incident rate | Closed cases with a related recurrence divided by eligible closed cases | Finds incomplete resolution or recurring conditions |
| Median downtime | Middle downtime value for comparable cases | Shows operational disruption without extreme cases dominating |
| Unresolved-case share | Open or unresolved cases divided by eligible cases | Reveals evidence or diagnostic gaps |
| Preventive completion rate | Completed planned maintenance divided by scheduled maintenance | Tests maintenance execution |
| Incorrect-item return rate | Returns caused by wrong component selection divided by component issues | Tests identity and compatibility controls |
| Replacement demand by component | Approved replacements divided by installed component exposure | Supports stock and lifecycle planning |
| First-contact resolution share | Eligible cases resolved in the first controlled interaction | Assesses triage readiness for defined case types |
Define eligibility, inclusion, exclusion, and time windows before calculation. The formula name alone does not make two dashboards comparable.
10. Measure Severity and Downtime Consistently
A frequent minor setup issue and a rare service-blocking failure should not have the same decision weight.
An internal severity scale can consider:
- complete device stoppage;
- loss of one function on a multifunction system;
- ability to continue other approved services;
- stop-use requirement;
- electrical, heat, cooling, output, or leakage concern;
- need for technical inspection;
- customer appointment disruption;
- availability of approved backup equipment;
- market or professional-service implications.
Define downtime start and end points. Decide whether the timer begins at the first report, verified stop-use decision, or service-case acceptance. Decide whether it ends at shipment, component arrival, installation, functional verification, or return to service. Use one rule within each comparison.
11. Distinguish First Occurrence from Recurrence
Repeated incidents can indicate several different problems:
- the original issue was not correctly diagnosed;
- the corrective action addressed the symptom but not the cause;
- the replacement item was incompatible or incorrectly installed;
- maintenance instructions were unclear or not followed;
- the device returned to use before verification;
- a different issue produced a similar symptom;
- the site environment or operating practice remained unchanged.
Link recurrence records to the original case, but allow the reviewer to mark them as related, probably related, unrelated, or unresolved. Counting every similar symptom as the same fault can distort the result.
12. Analyze Preventive Maintenance as an Exposure
Do not assume that a completed maintenance checkbox caused lower incident rates. Compare defined cohorts.
유용한 질문은 다음과 같습니다.
- Were scheduled tasks completed on time?
- Did the task match the model and revision?
- Was the device active before and after maintenance?
- Which symptoms or component issues occurred in compliant and noncompliant groups?
- Did a maintenance change affect only one site, region, or configuration?
- Was the observation period long enough?
- Did training, component changes, or software updates occur at the same time?
Use the findings to improve the schedule, task definition, training, or record quality. Avoid claiming causation from a simple before-and-after count.
13. Segment by Configuration and Revision
Portfolio averages can hide a narrow problem.
Segment the data by:
- exact model;
- configuration code;
- hardware and software revision;
- installed handle or module;
- cartridge, tip, needle, or applicator type;
- 시장 및 전기 프로필;
- installation cohort;
- device age band;
- site type;
- servicing region;
- maintenance compliance;
- training status where documented.
If one revision shows a higher incident pattern, verify data completeness and exposure before restricting the entire model family.
14. Protect Decisions from Small-Sample Error
A fleet of three devices can appear perfect until one incident doubles the rate. Use safeguards:
- show the numerator and denominator beside every rate;
- set a minimum exposure before ranking;
- use confidence intervals or statistical review when decisions are material;
- display Unknown and unresolved cases;
- compare several time windows;
- separate new installations from mature cohorts;
- review whether one customer or service campaign dominates the data;
- avoid league tables when sample sizes are not comparable.
For small populations, use a qualitative review with explicit uncertainty rather than a confident numerical ranking.
15. Create a Portfolio Decision Matrix
Convert the metrics into defined actions.
| Data pattern | Possible interpretation to verify | Portfolio action |
|---|---|---|
| Low normalized incidents, low recurrence, controlled downtime | Support process appears stable for the observed exposure | Retain; continue monitoring |
| High tickets but low verified-fault rate | Setup, training, consumable, or documentation issue may dominate | Improve guidance and triage before changing the product |
| One component drives repeated cases | Component identity, compatibility, maintenance, or supply path may need review | Focus component action and stock strategy |
| One revision or configuration has a concentrated pattern | A version-specific condition may exist | Technical review; restrict or correct the affected configuration if confirmed |
| Preventive maintenance is overdue where issues cluster | Maintenance execution may be contributing | Improve schedule, accountability, and follow-up |
| Low incident rate but long downtime | Parts, diagnosis, logistics, or escalation may be weak | Improve serviceability and regional support |
| High unresolved-case share | Evidence collection or diagnostic capability is insufficient | Improve case forms, training, and escalation |
| Declining installed base with rising support complexity | Legacy burden may exceed strategic value | Plan successor, replacement, or controlled retirement |
The matrix suggests questions and actions. It does not replace technical review or local compliance decisions.
16. Decide Whether to Retain or Expand a Category
Retain or expand only after considering:
- normalized incident and severity patterns;
- serviceability and support readiness;
- configuration complexity;
- component supply and successor coverage;
- maintenance workload;
- training requirements;
- installed-base growth;
- regional technical capacity;
- buyer demand and service-menu role;
- professional-use and market requirements.
Stable support data can strengthen a case for expansion, but it should be combined with commercial and service-menu evidence. Fault data alone does not show market demand.
17. Improve Training or Documentation Before Dropping a Device
If cases cluster around setup, cleaning, consumable installation, connection order, storage, or misunderstood error messages, the first action may be operational.
Possible improvements include:
- model-specific quick-start guides;
- configuration-specific handle diagrams;
- clear consumable and cartridge identification;
- stop-use and escalation criteria;
- maintenance checklists;
- short evidence-capture instructions;
- refresher training for recurring issues;
- updated translations;
- version labels on documents;
- quotation and handover records that preserve the supplied configuration.
Measure the same incident categories after the change. Do not assume that issuing a new document completed the corrective action.
18. Adjust Replacement and Consumable Coverage
Case data can improve inventory decisions when it is linked to installed exposure.
Use it to identify:
- high-impact replacement handles or applicators;
- cartridges or treatment components with repeat demand;
- cables, containers, tubing, or accessories that create service delays;
- components frequently ordered incorrectly;
- regional stock gaps;
- legacy components with active installed demand;
- stock with no remaining supported population;
- successors that are not valid for every old revision.
Do not stock from incident counts alone. Combine verified component demand with compatible installed quantity, current stock, lead time, regional transfer capability, lifecycle, and item value.
19. Restrict or Revise a Configuration When Evidence Supports It
A model can remain viable while one optional combination creates disproportionate support work.
Before restricting a configuration:
- verify the device and component identities;
- confirm the exposure denominator;
- review severity and recurrence;
- compare other revisions and markets;
- check training, installation, and maintenance differences;
- confirm the technical finding;
- identify installed customers affected;
- define the corrected configuration or successor path;
- update catalogs, quotation tools, compatibility records, and service guidance;
- monitor results after the change.
Avoid removing an entire product family because a local naming or configuration-control problem created incorrect cases.
20. Plan Upgrade, Successor, or Retirement Decisions
An older device or component may need a controlled transition when:
- support cases increase after normalizing for the remaining active population;
- correct replacement components are no longer reliably available;
- diagnostic evidence is incomplete for older revisions;
- service effort and downtime remain high after corrective actions;
- the supported successor is clearer and more maintainable;
- market or professional-use requirements have changed;
- the installed population has declined below a practical support threshold.
Preserve old records, open cases, component mappings, and installed-customer obligations. Retirement from new sales does not erase the support history of devices still operating.
21. Analyze A0648 Facial-Platform Data by Function
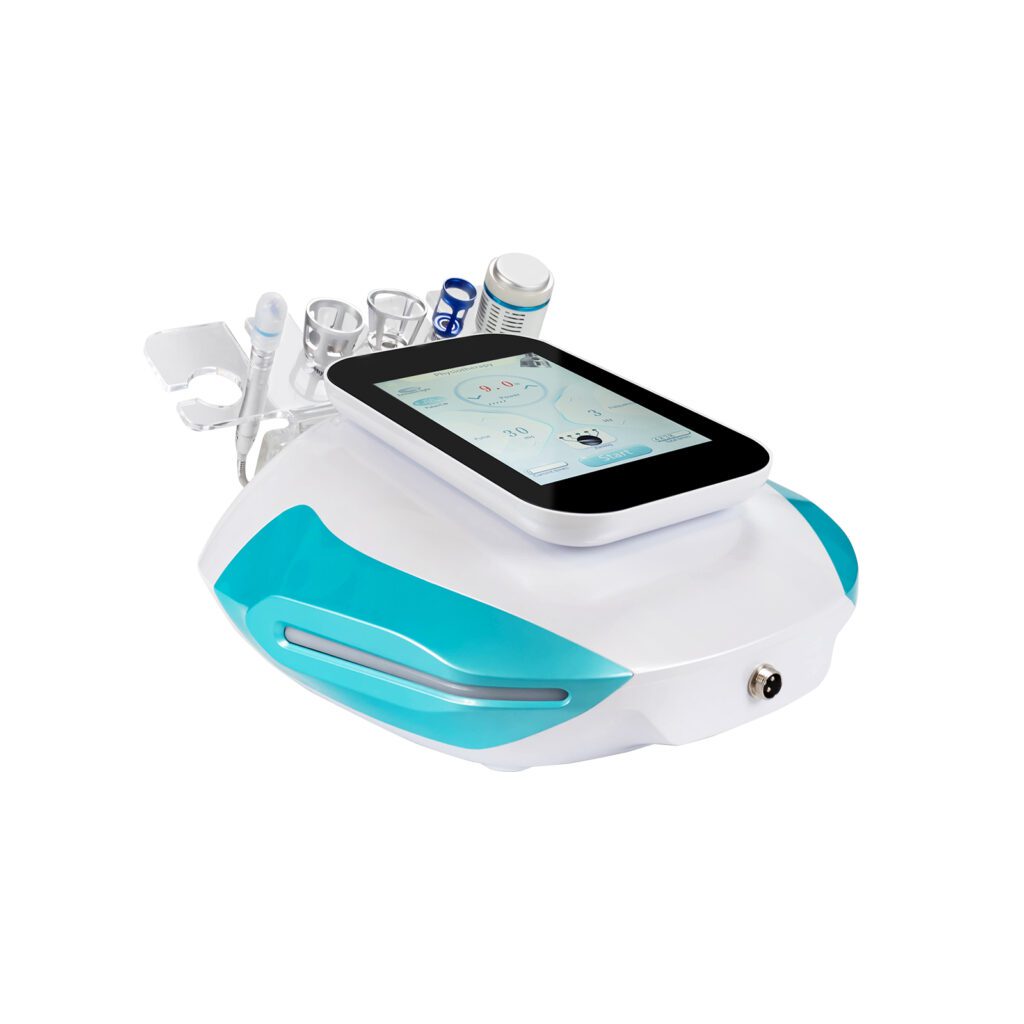
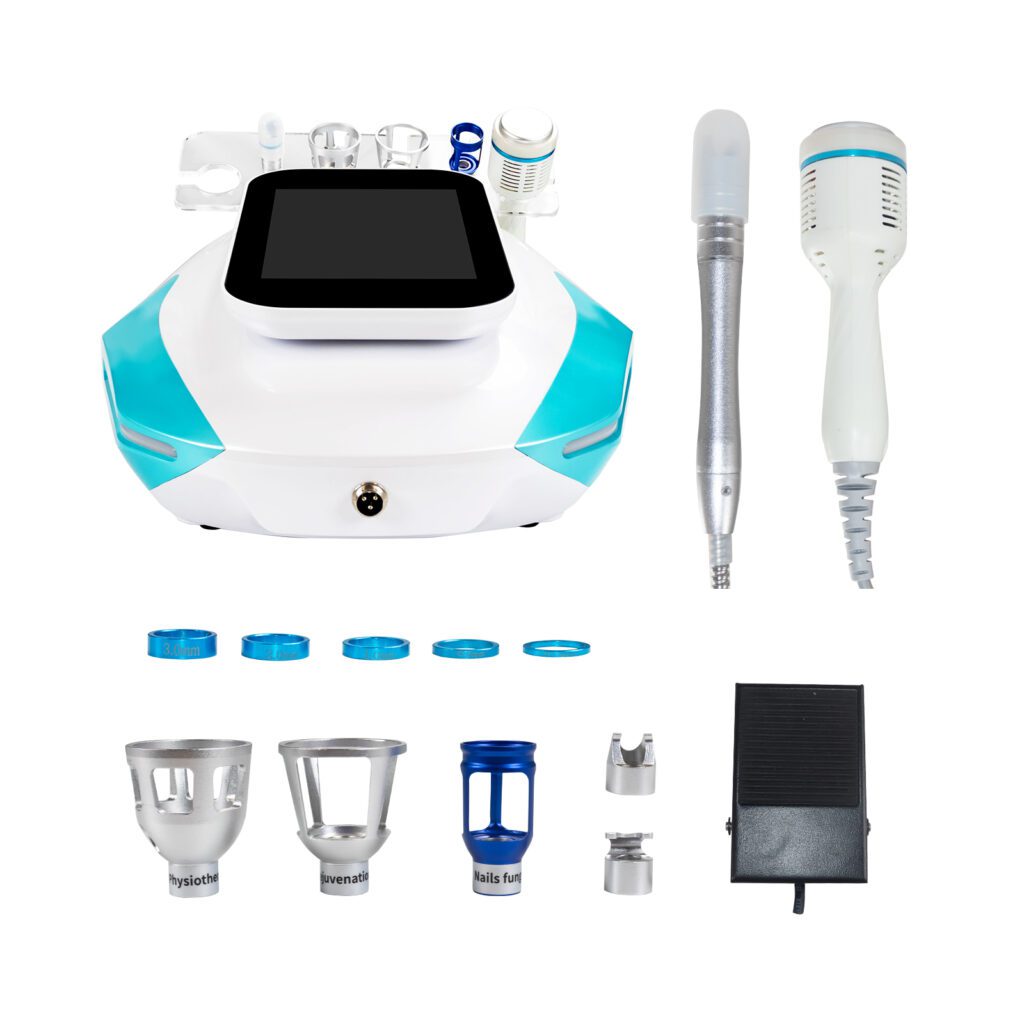
그만큼 SHEFMON A0648 hydro microdermabrasion machine is presented as a multifunction facial platform. Analyze cases by installed tool and affected function rather than assigning every report to one undifferentiated model bucket.
For an A0648 cohort, capture:
- exact supplied handpieces and tools;
- tip, container, tubing, cable, and accessory identities;
- reported flow, suction, connection, interface, or tool symptom where applicable;
- cleaning and maintenance status;
- setup and consumable checks;
- verified component or main-unit finding;
- whether other functions remained available;
- replacement, maintenance, training, or document action;
- recurrence after closure.
This structure can show whether action belongs at the device, handpiece, consumable, maintenance, or training level.
22. Analyze A0152 Data by Handle and Needle Relationship
그만큼 SHEFMON A0152 RF-microneedling device currently lists different working-handle arrangements and several tip configurations. Separate durable handle incidents from needle-head consumption and installation issues.
기록:
- A0152 configuration and revision;
- working-handle identity;
- needle-head type and approved relationship;
- symptom and error evidence;
- connection, installation, and compatibility checks;
- operator training status;
- verified handle, consumable, device, or use-condition finding;
- replacement component or consumable used;
- post-action verification and recurrence.
RF-microneedling incidents should follow professional-use, stop-use, escalation, and local reporting requirements. Portfolio analysis must not encourage unqualified internal repair.
23. Analyze A0204 Data by Module and Cartridge
그만큼 SHEFMON A0204 focused HIFU platform lists multiple functions, handles, and cartridge groups. A console-level incident count can hide which installed configuration creates the workload.
Segment by:
- A0204 configuration and revision;
- 9D or 7D arrangement where applicable;
- optional handle or module;
- cartridge identity and depth or size;
- usage or status information available from the approved records;
- recognition, connection, output, or physical-condition symptom where documented;
- maintenance and storage history;
- verified finding;
- replacement or successor component;
- downtime and recurrence.
Compare like configurations with adequate exposure. Do not combine every cartridge or optional handle into one apparent HIFU fault rate.
24. Keep A0423 and A0426 Laser Data Separate
현재 페이지는 다음과 같습니다. SHEFMON A0423 diode laser 그리고 SHEFMON A0426 diode laser list choices involving wavelength arrangement, handle power, and spot size. Preserve these details in each incident record.
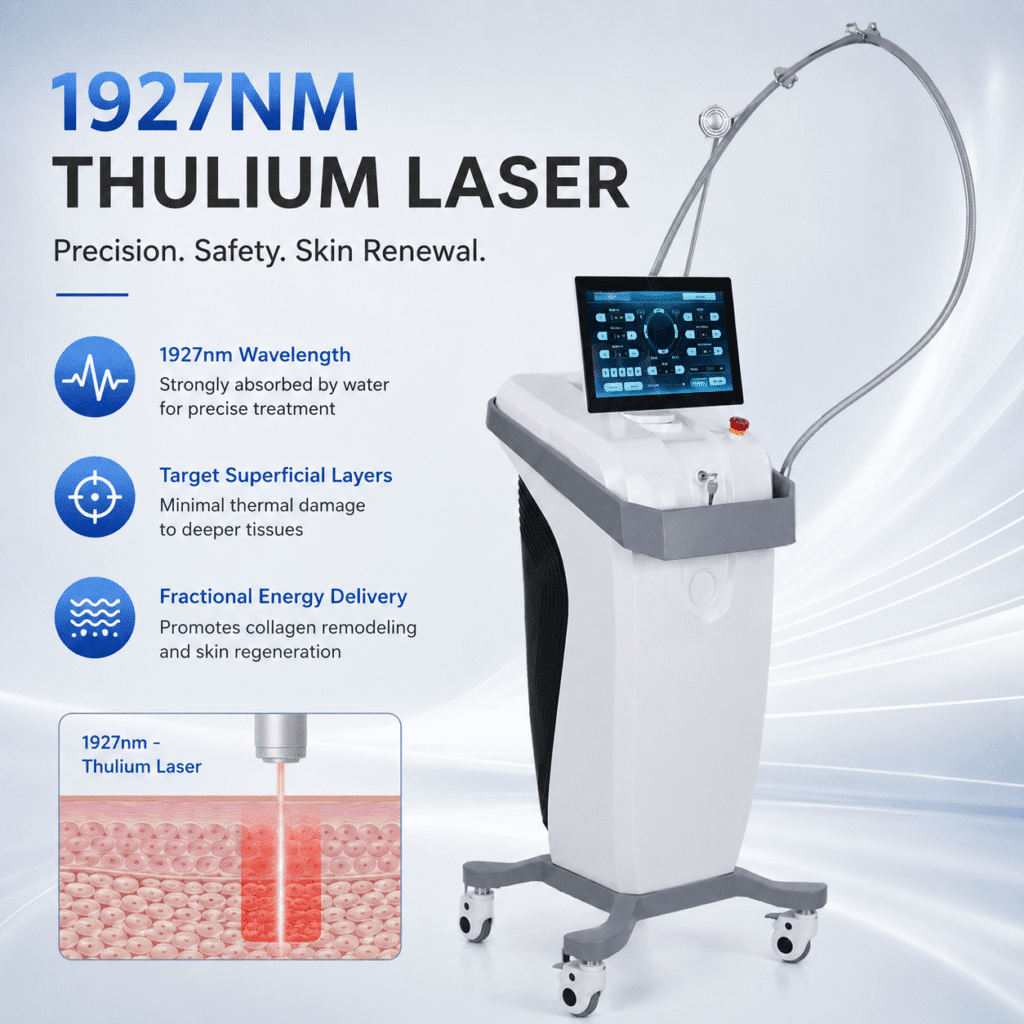
분석하다:
- 정확한 모델 및 구성;
- handle ID and revision;
- wavelength, power, and spot-size relationship;
- cooling, electrical, interface, or handle symptom;
- stop-use decision;
- diagnostic evidence and authorization level;
- verified component or system finding;
- replacement-handle relationship;
- post-service verification;
- downtime, recurrence, and lifecycle status.
Do not pool A0423 and A0426 results unless the analysis is intentionally category level and clearly retains model-specific findings. Similar option descriptions do not prove shared components or shared fault behavior.
25. Analyze B0155 by Applicator Exposure
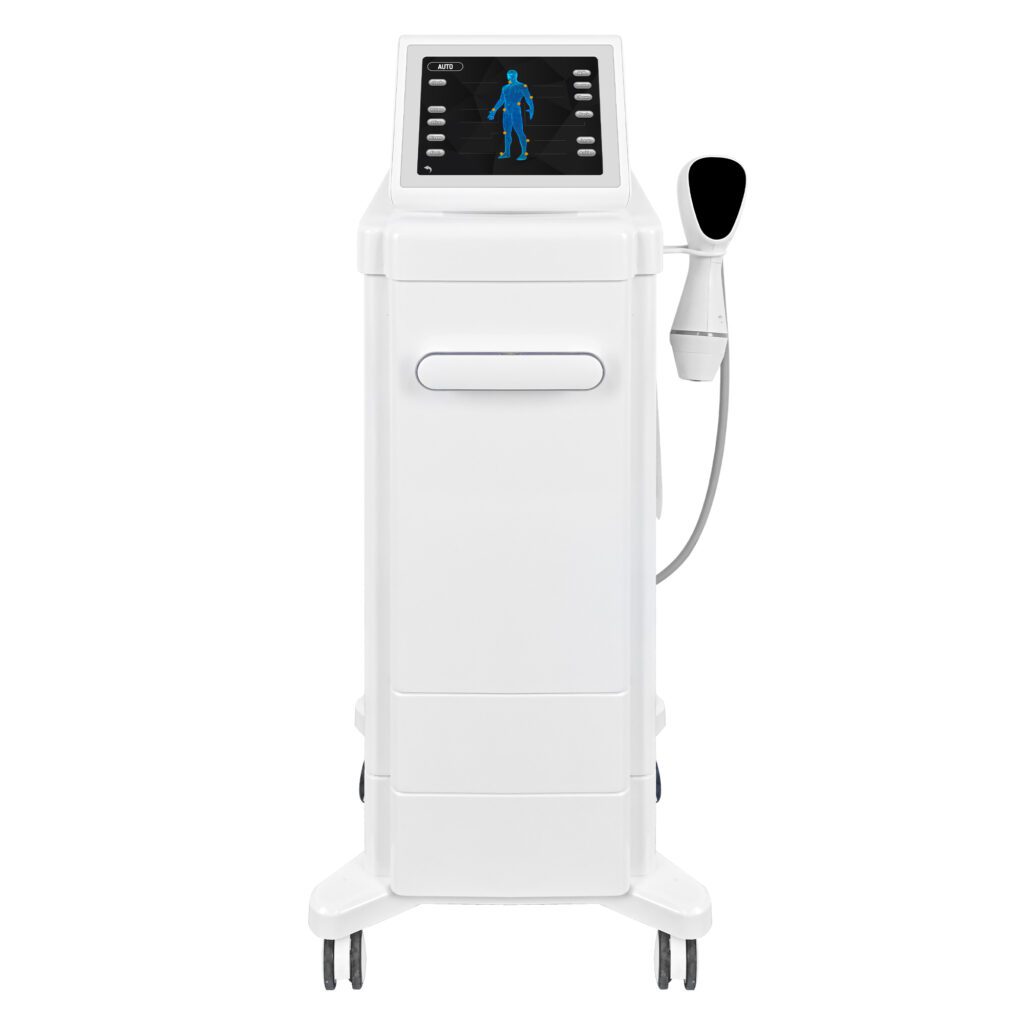
그만큼 SHEFMON B0155 body-care system is described with handles for body and smaller-area applications. Count installed applicators and analyze cases at the handle level.
유용한 필드는 다음과 같습니다.
- B0155 configuration and revision;
- installed handle set and quantity;
- affected applicator;
- cable, connector, recognition, suction, roller, RF, or physical symptom where applicable to the confirmed configuration;
- setup and cleaning checks;
- verified finding;
- replacement or maintenance action;
- regional component availability;
- downtime and recurrence;
- removed-component disposition.
Use installed component-months when handle quantities differ across configurations. Console count alone can understate exposure.
26. Build a Portfolio Review Dashboard
The dashboard should allow users to move from summary to evidence.
Recommended views include:
- active installed units and component exposure;
- verified incident rate by model and configuration;
- severity and downtime distribution;
- symptom versus verified-finding comparison;
- repeat incidents;
- preventive maintenance completion;
- open and unresolved cases;
- replacement components used;
- incorrect-item returns;
- top data-quality gaps;
- legacy devices and components approaching review;
- corrective actions and owners.
Avoid a red-to-green ranking without denominators, confidence, or action context. The dashboard should help reviewers investigate, not merely label.
27. Set a Review Cadence and Decision Workflow
Use both event-driven and periodic review.
Immediate review triggers can include:
- a severe incident;
- repeated symptoms after corrective work;
- a new configuration or component revision;
- a compatibility correction;
- a discontinued replacement item;
- an unresolved cooling, electrical, output, or leakage concern;
- a cluster within one site, region, or installation cohort.
The periodic portfolio review should include product, technical, support, inventory, sales-operations, and relevant local-market roles. Each decision should record the evidence window, affected population, uncertainty, action, owner, due date, and follow-up metric.
28. Fault and Maintenance Data Checklist
- Every incident links to a physical installed unit.
- Model, configuration, revision, market, and installed components are known.
- Symptoms remain separate from verified findings and root causes.
- Consumable use, maintenance, configuration changes, and faults are classified separately.
- Exposure denominators are documented and consistent.
- Severity and downtime use controlled definitions.
- Repeat incidents link to earlier cases.
- Unknown and unresolved cases remain visible.
- Small samples show numerator, denominator, and uncertainty.
- Device, component, site, region, age, and revision cohorts can be compared.
- Preventive maintenance analysis considers other changing factors.
- Replacement items link to exact compatibility records.
- Portfolio actions name an owner and follow-up date.
- Older installed devices retain support and lifecycle records.
- High-energy and professional-use cases follow appropriate escalation rules.
- Published conclusions do not exceed the available evidence.
자주 묻는 질문
1. Can raw fault counts be used to compare beauty devices?
They should not be used alone. Compare verified events against a consistent exposure denominator such as active device-months, operating hours, cycles, or installed component-months, and show sample size and data quality.
2. What is the difference between a symptom and a fault?
A symptom is what the user observes. A fault is a verified equipment or component condition. One symptom can have several possible causes, including setup, consumable, maintenance, environment, component, or main-unit issues.
3. Which metric is most important for portfolio decisions?
No single metric is sufficient. Use incident rate, severity, downtime, recurrence, unresolved cases, maintenance completion, component demand, and data confidence together.
4. How should new models with little history be evaluated?
Keep them in a separate launch cohort, show limited exposure, monitor more frequently, and avoid direct ranking against mature fleets until the sample becomes meaningful.
5. Does high ticket volume mean a device should be removed?
Not necessarily. High ticket volume may reflect a large installed base, training questions, setup issues, incomplete documentation, or poor triage. Verify normalized fault patterns and root causes before changing the portfolio.
6. How can maintenance data affect inventory planning?
Verified replacement events can reveal component demand by installed exposure. Combine them with compatible units, current stock, lead time, regional transfer capability, item value, and lifecycle before setting inventory policy.
7. Should A0423 and A0426 data be combined?
Keep model and configuration data separate. A category-level report may summarize both, but it must preserve their individual handle relationships, option values, incident patterns, and support actions.
8. When should a configuration be restricted?
Only after verifying a configuration-specific pattern, exposure, severity, alternative explanations, technical finding, affected installed population, corrective path, and follow-up plan.
9. How often should the portfolio be reviewed?
Review on a defined schedule and after significant events such as severe incidents, repeated cases, component changes, compatibility corrections, supply discontinuations, or concentrated regional patterns.
10. 셰프몬(SHEFMON)에는 언제 연락해야 하나요?
Contact SHEFMON when current records do not resolve a configuration, component relationship, diagnostic reference, maintenance boundary, replacement, successor, lifecycle state, or other model-specific question needed for a sound portfolio decision.
결론
Fault and maintenance data improve portfolio decisions only when the records describe the correct devices, components, exposure, findings, actions, and outcomes. A disciplined system normalizes incident counts, preserves uncertainty, separates operational issues from verified faults, and converts patterns into specific improvements or lifecycle decisions.
Businesses can review facial, RF-microneedling, HIFU, laser, and body-care platforms in the SHEFMON beauty-machine range. To clarify a configuration, component, maintenance, replacement, or successor issue affecting the analysis, 셰프몬에게 연락하세요 with the exact model, revision, installed component, market, and service evidence.